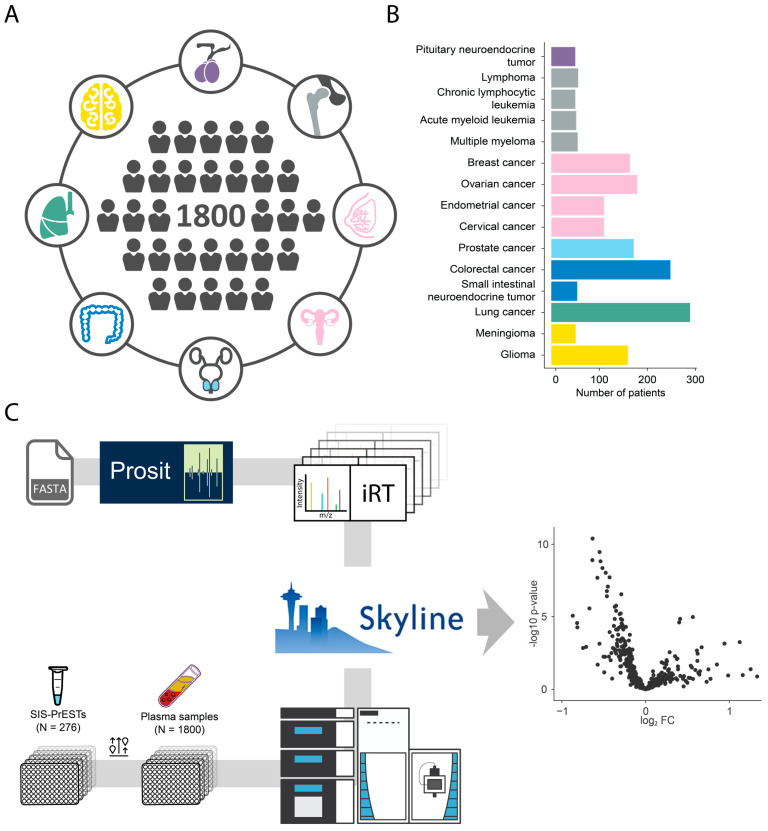
Figure 1.
Overview of the pan-cancer cohort and study design. (A) Cohort of investigated cancer patients (n = 1800) distributed across eight different organs (each color highlights tissue origin of the cancer). (B) Distribution of patient samples (n = 1800) across fifteen different cancer subtypes. (C) Overview of analytical workflow, which includes library generation (top row) and flow of patient samples with spike in SIS-PrESTs (bottom row) prior to chromatography extraction and data analysis (middle).

