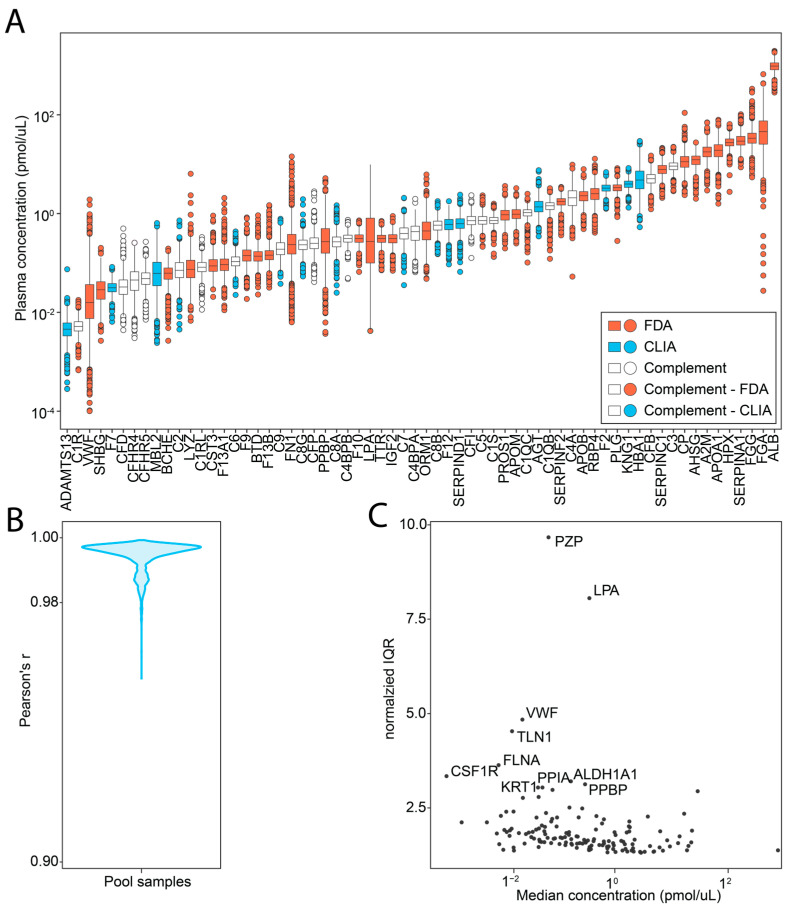
Figure 2.
Proteins quantified in the targeted proteomics workflow. (A) The dynamic range and concentration (y-axis) of all FDA (red) and CLIA (blue) markers, supplemented with complement system proteins (white) (x-axis). (B) Density distribution of the cross-correlation (Pearson’s r) between all pooled technical replicates in the dataset. (C) Inter-individual variation in the human plasma proteome visualized as the normalized interquartile range (IQR, y-axis) plotted versus the median protein concentration (pmol/µL, x-axis).

