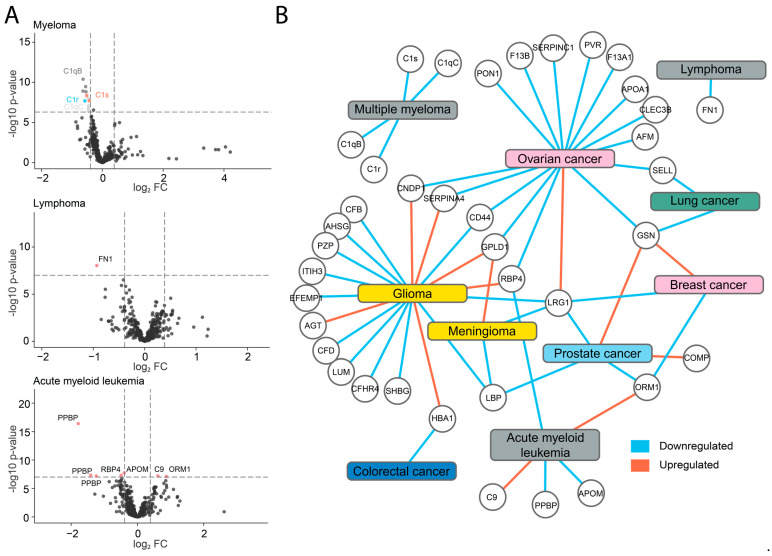
Figure 3.
Identification of differentially expressed proteins in the pan-cancer cohort. (A) Comparisons of plasma protein levels between myeloma, lymphoma, and acute myeloid leukemia versus all other cancers group (Student’s t-test), visualized in volcano plots with labels on the topmost significant proteins. (B) Network visualization of all protein targets identified as differentially expressed in one cancer compared to all the other cancers (p-value < 0.0005, Bonferroni adj.). Blue and red connections signify up- or downregulation, respectively. Each cancer is colored by tissue of origin.

