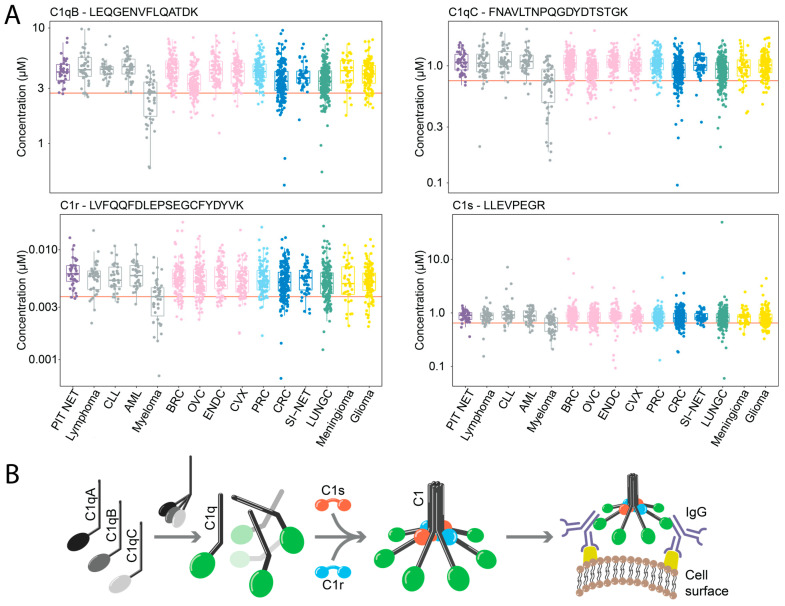
Figure 4.
Quantification of the complement system and its circulating components across 15 different cancers. (A) Boxplots that visualize the protein levels (y-axis, log2 concentration) of C1qB, C1qC, C1r and C1s across all patients (n = 1800), grouped by cancer type (y-axis) and colored by tissue origin. (B) General overview of the C1 complex with genes involved in its architecture.

