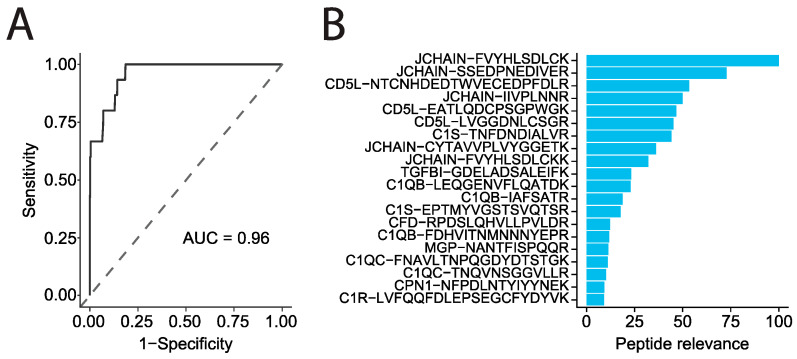
Figure 5.
Data-driven analysis reveals a panel of biomarkers suitable for MM prediction. (A) ROC curve visualizing the performance and classification specificity of a model generated by a random forest algorithm, which was used to distinguish MM from all other fourteen cancers, with an AUC of 0.96. (B) Feature selection based on peptides, visualizing their relevance score (y-axis) and impact on the model used to separate MM from the fourteen other cancers (color intensity represents the impact level of each analyte, ranging from 0 to 100).

