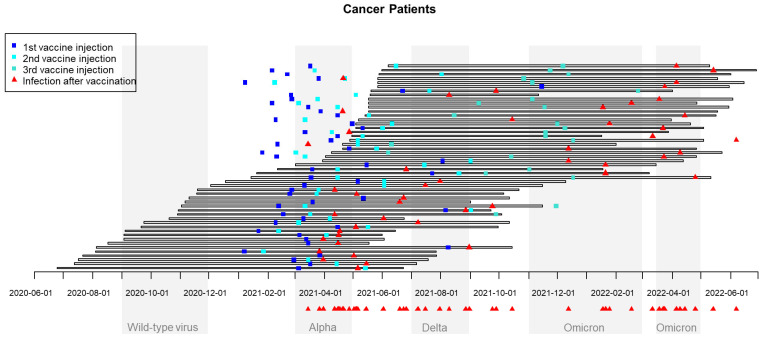
Figure 2.
Chronological waves of SARS-CoV-2 infection in France and dates of vaccination and breakthrough SARS-CoV-2 infection in cancer patients. The 49 CPs with reported SARS-CoV are reported in 49 rows: horizontal bars correspond to the time between inclusion and the end of participation in the study, blue squares correspond to vaccine injections, and red triangles correspond to reported date of COVID infection.

