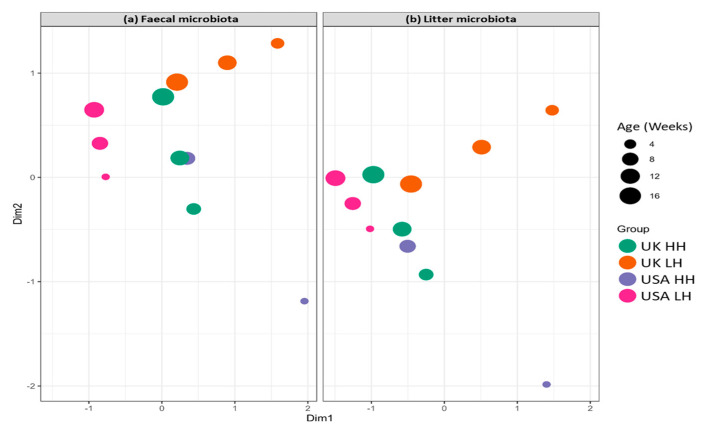
Figure 20.
MDS plot of mean fecal (a) and litter (b) microbiota of key elite turkey pedigree lines at a range of different ages from both high hygiene (HH) pedigree farms and low hygiene (LH) farms in the UK and US breeding programs. The closer the markers, the more similar the microbiome in the samples. This plot reveals that the microbiome changes with age and also highlights that the LH environments are quite distinct from each other and the HH environments.

