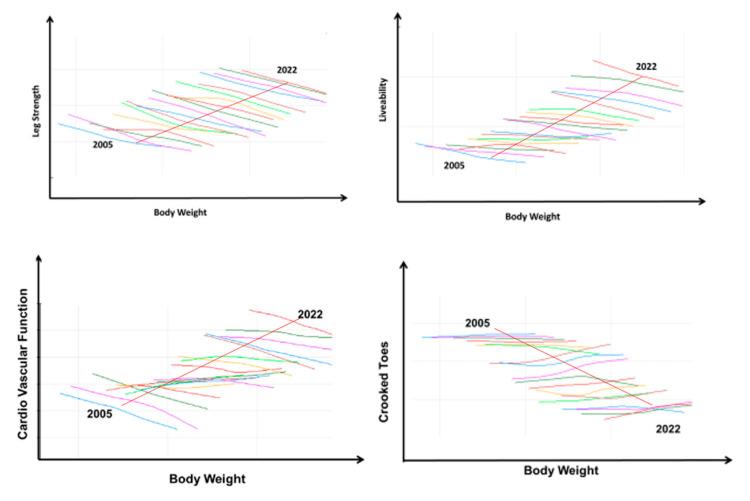
Figure 23.
Long-term relationships between live body weight and leg strength (%), livability (%), oxygen saturation in the blood and crooked toes (%) in broilers. Each colored line represents the relationship between breeding values for each trait within a year. The broken arrow represents the joint direction of the average breeding value for each trait involved in the trade-off. Source: [116].

