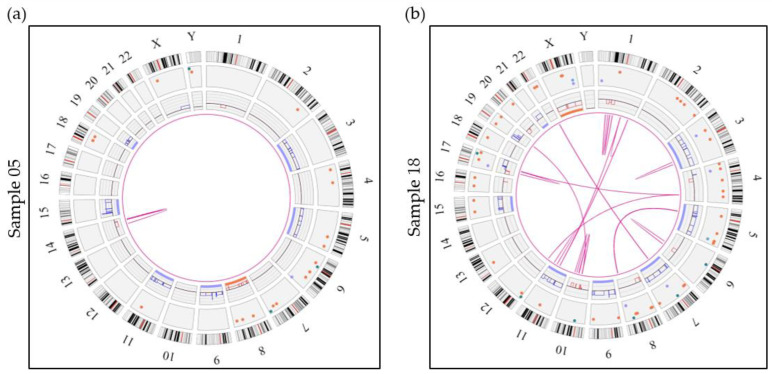
Figure 2.
Circos plots showing 2 examples of hyperdiploid genomes. (a) Sample 05 represents a hyperdiploid genome (absence of an IGH translocation) showing numerous SVs and CNVs including gains of 6 classic odd-numbered chromosomes (3, 5, 9, 11, 15 and 19). Sample 05 also shows an intrachromosomal translocation call by the software, which represents an interstitial deletion of the long arm of chromosome 14. (b) Sample 18 shows a much more complex case of hyperdiploidy (absence of an IGH rearrangement) with gains of chromosomes 3, 5, 7, 9, 11, 15 and 21 in addition to many more SVs and CNVs. This sample also shows 13 intrachromosomal translocations and 18 interchromosomal translocations. Aneuploidies are represented by blue (gains) and orange (losses) lines in the inner circle and translocations are represented by pink lines in the center. The colored dots in the outer circle represent SVs (deletions, inversions, duplications, insertions).

