Figure 5.
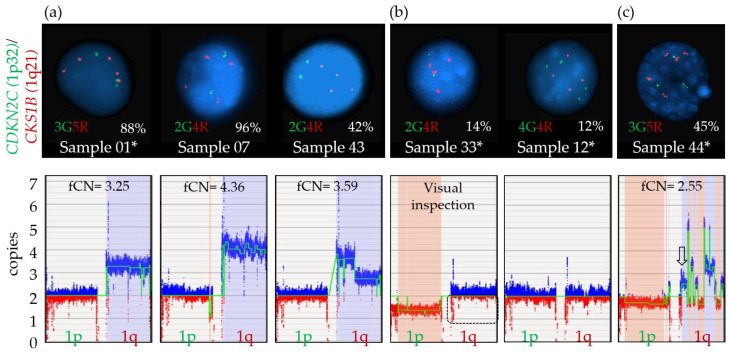
Amplification 1q calls by FISH and OGM. (a) Amplification of 1q is defined as detection of at least four copies of the CKS1B probe by FISH. Upper panel: Representative interphasic nuclei of each case showing at least four copies by FISH for this specific locus (red signal), with various clone sizes as indicated by percentage of positive cells (sample 01, 07, 43). Green signals represent the 1p32 locus on chromosome 1. Lower panel: Amplification call by OGM, as defined by a fractional copy number ≥ 3 for each sample. (b) Upper panel: Representative interphasic nuclei of samples showing four CKS1B signals by FISH (red signal), with clone size below sensitivity of the OGM method (sample 33, 12). Lower panel: Genome view of the short arm (1p) and long arm (1q) of chromosome 1 shows a decreased intensity of red markers (dotted rectangle) compared to blue markers for sample 33 but such variation cannot be identified for sample 12. (c) Upper panel: Representative interphasic nuclei of sample 44 showing a plasma cell with five CKS1B signals by FISH (red signal). Lower panel: As visualized from the genome view of the long arm (1q) of chromosome 1, various fCN values are detected, ranging from 1.65 to 5, with an fCN specific for the CSK1B region of 2.55 (arrow). * Samples with a non-diploid genome. In the lower panels, blue boxes represent gains and red boxes represent losses.

