Figure 2.
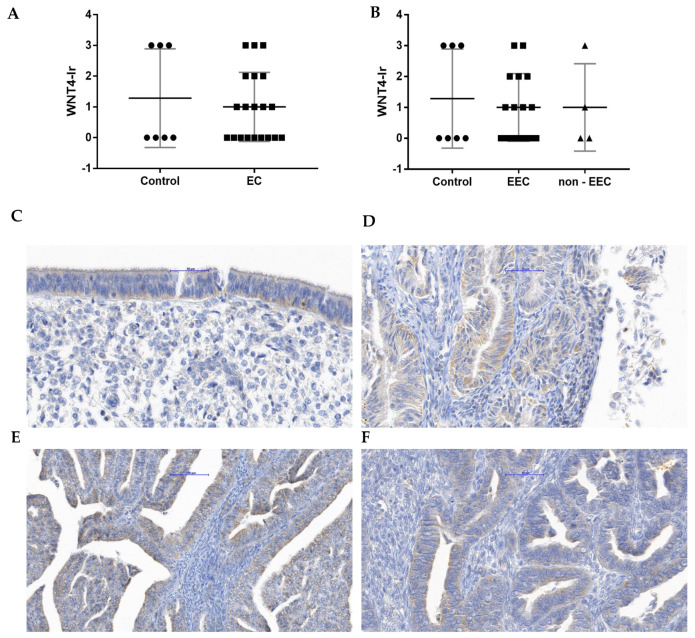
The Kruskal–Wallis comparison of WNT4-Ir between control (n = 7) and EC group (n = 20; (A)) as well as control (n = 7) and endometrial samples of patients diagnosed with EEC and non-EEC (EEC, n = 16; non-EEC n = 4; (B)). For each graph, the horizontal line shows the mean with SD. The representative microphotographs present WNT4-Ir in benign endometrium (C) and endometrial tissue fragments from samples where tumors were graded as G1 (D), G2 (E), and G3 (F). Magnification ×40.

