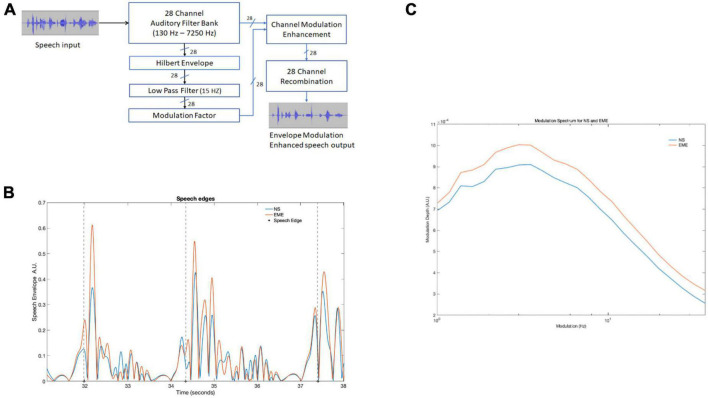
FIGURE 1.
(A) Depicts the entire processing pipeline involved in the speech envelope modulation enhancement algorithm. (B) Three edge onsets (marked by dotted lines) identified by the algorithm in both natural and EE speech conditions in a 7-s speech recording. The large peaks after the dashed line were identified by the algorithm. (C) Shows modulation spectrum of the entire story for the two conditions (NS and EME). The figure depicts EME as having higher modulation. NS, natural speech; EME, envelope modulation enhancement.

