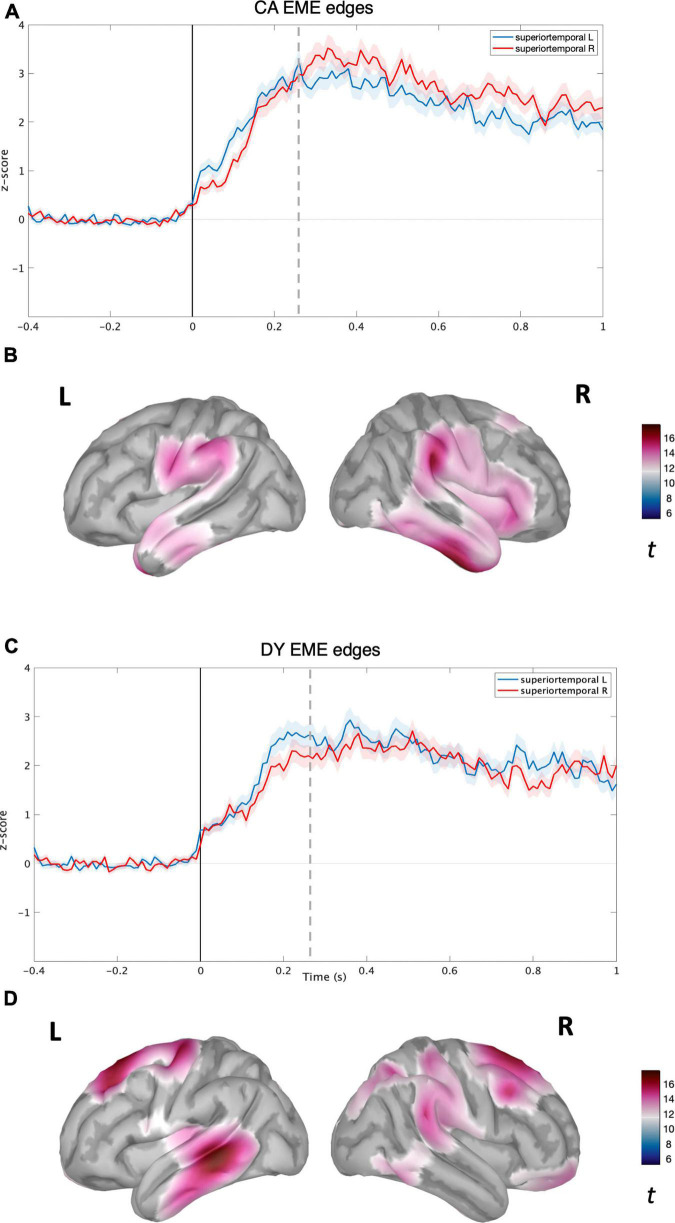
FIGURE 3.
Source level time-domain within-sample analysis for EME condition. (A) Averaged time course obtained from bilateral superior temporal gyrus for EME condition with standard error (shaded) plotted on top (z-score) for CAs. (B) Left and right cortical maps depicting statistically significant (p < 0.05, FDR) activity (post-stimulus >pre-stimulus) for NS condition (t-value). (C) Averaged time course obtained from bilateral superior temporal gyrus for EME speech condition with standard error (shaded) plotted on top (z-scores) for DYs. (D) Left and right cortical maps depicting statistically significant (p < 0.05, FDR) activity (post-stimulus >pre-stimulus) for EME speech condition. The dotted line corresponds to the time point (270 ms) plotted in brain space.

