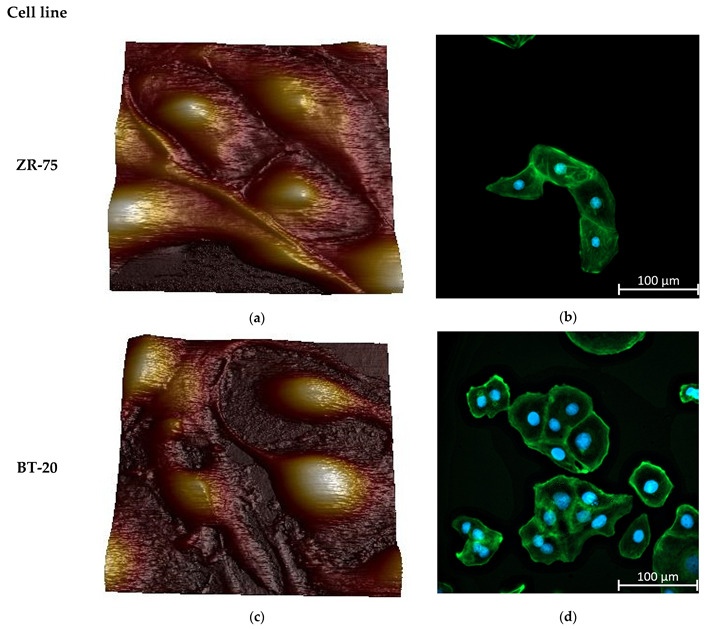
Figure 2.

Morphology and actin cytoskeleton organization in BT-20 and ZR-75 breast cancer cells. (a) Three-dimensional topographic AFM image of living ZR-75 cells. The image was recorded using PF QNM in fluid mode. The scan size is 94.7 μm × 94.7 μm; the resolution is 521 × 512 pixels. (b) Representative immunofluorescence image showing the distribution of F-actin staining by Alexa Fluor488-Phalloidin in ZR-75 cells (green). Nuclei stained with DAPI are shown in blue. The exposure time for Alexa Fluor488-Phalloidin fluorescence was 1.5 s. The image size is 333 μm × 333 μm; the resolution is 2048 × 2048 pixels. (c) Three-dimensional topography AFM image of living BT-20 cells. The image was recorded using PF QNM in fluid mode. The scan size is 94.7 μm × 94.7 μm; the resolution is 521 × 512 pixels. (d) Representative immunofluorescence image showing the distribution of F-actin staining by Alexa Fluor488-Phalloidin in BT-20 cells (green). Nuclei stained with DAPI are shown in blue. The exposure time for Alexa Fluor488-Phalloidin fluorescence was 24 μs. The image size is 333 μm × 333 μm; the resolution is 2048 × 2048 pixels.
