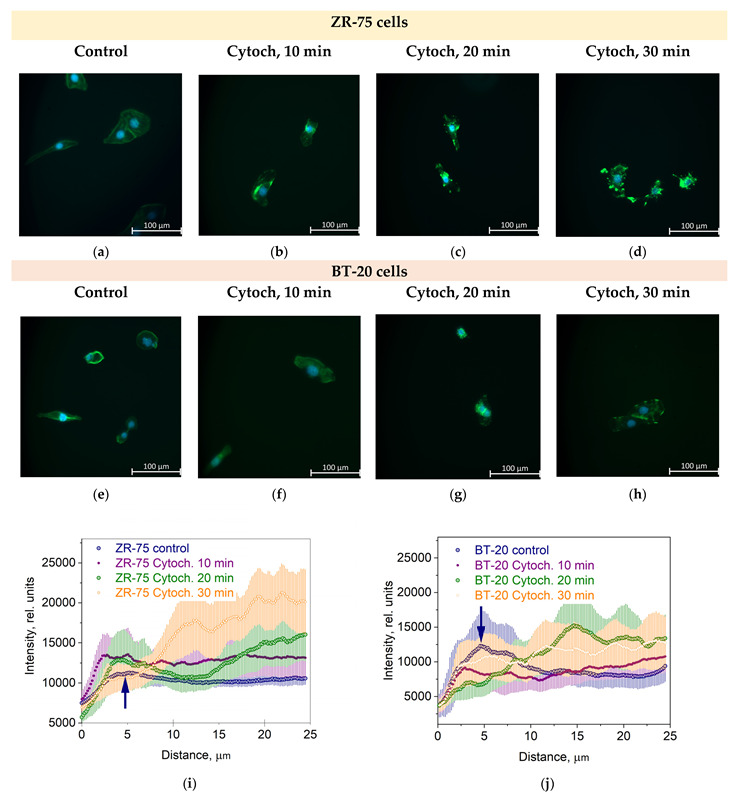
Figure 3.

The effect of cytochalasin D (Cytoch.) on the spatial distribution of actin cytoskeleton structures in BT-20 and ZR-75 breast cancer cells. (a–h) Representative immunofluorescence images showing the distribution of F-actin staining by Alexa Fluor488-Phalloidin (green) in ZR-75 cells (a–d) and BT-20 cells (e–h) after cell treatment with cytochalasin D (10–30 min). Nuclei stained with DAPI are shown in blue. The exposure time for Alexa Fluor488-Phalloidin fluorescence was 1.5 s for every experiment. The image size is 333 μm × 333 μm; the resolution is 2048 × 2048 pixels. (i,j) The averaged profiles of the F-actin density spatial distribution in a direction from the cell edge to the nucleus after cell treatment with cytochalasin D (10–30 min). Data are presented as the mean and the limits of 95% CI. The blue arrows indicate the maximal density of the actin cortical cytoskeleton.
