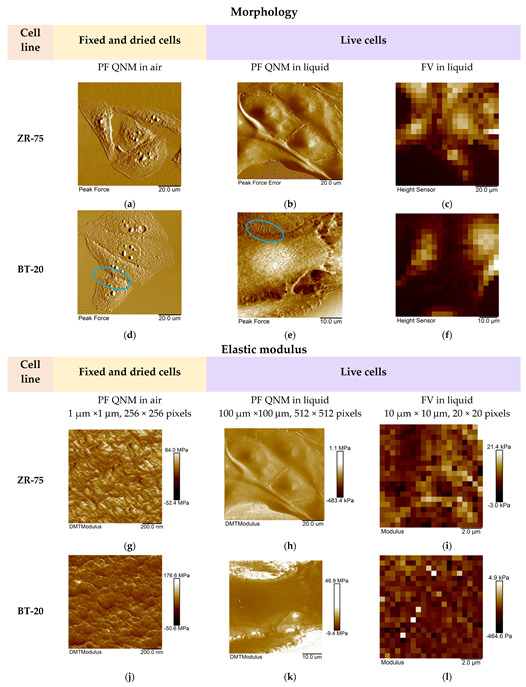
Figure 4.

Representative AFM images of the studied breast cancer cells recorded using three AFM modes. (a–f) The AFM images (PeakForce, PeakForce Error, and Height) obtained using different AFM modes and representing the studied cell morphology. Blue ovals show the microvilli of BT-20 cells observed in the AFM images recorded using PF QNM mode in air and liquid. The size of the images recorded using FV mode was 10 μm × 10 μm. (g−l) The maps of the elastic modulus (DMT modulus and Young’s modulus) of the studied cells obtained using different AFM modes.
