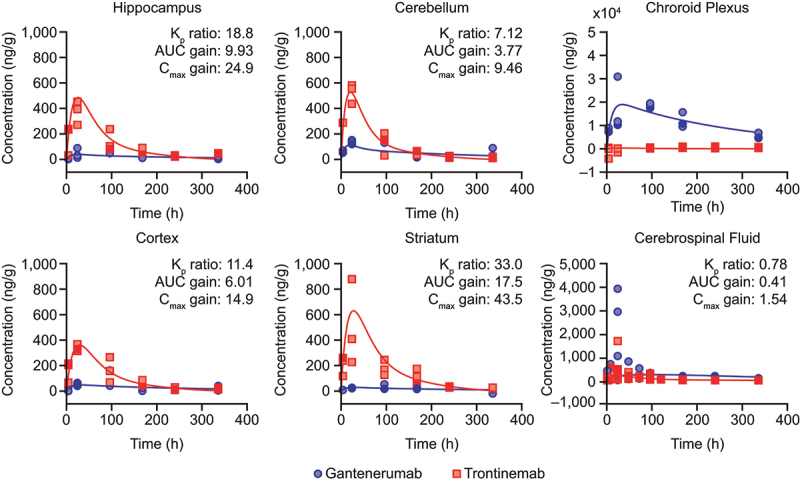
Figure 3.

Observed brain concentration of gantenerumab (blue circles) and trontinemab (red squares) overlaid with model simulations (lines) in NHPs. Plots showing concentration of the mAb in the hippocampus, cerebellum, choroid plexus, cortex, striatum, and cerebrospinal fluid up to 336 h post-dose. For graphical representation, observed concentrations were corrected for the contribution of residual plasma using the naïve approach, leading to some concentrations being displayed with negative values. Kp ratio, AUC gain, and Cmax gain were not assessed for the choroid plexus. AUC, area under the curve; Cmax, maximum concentration; Kp, brain distribution coefficient; h, hour; NHP, non-human primate.
