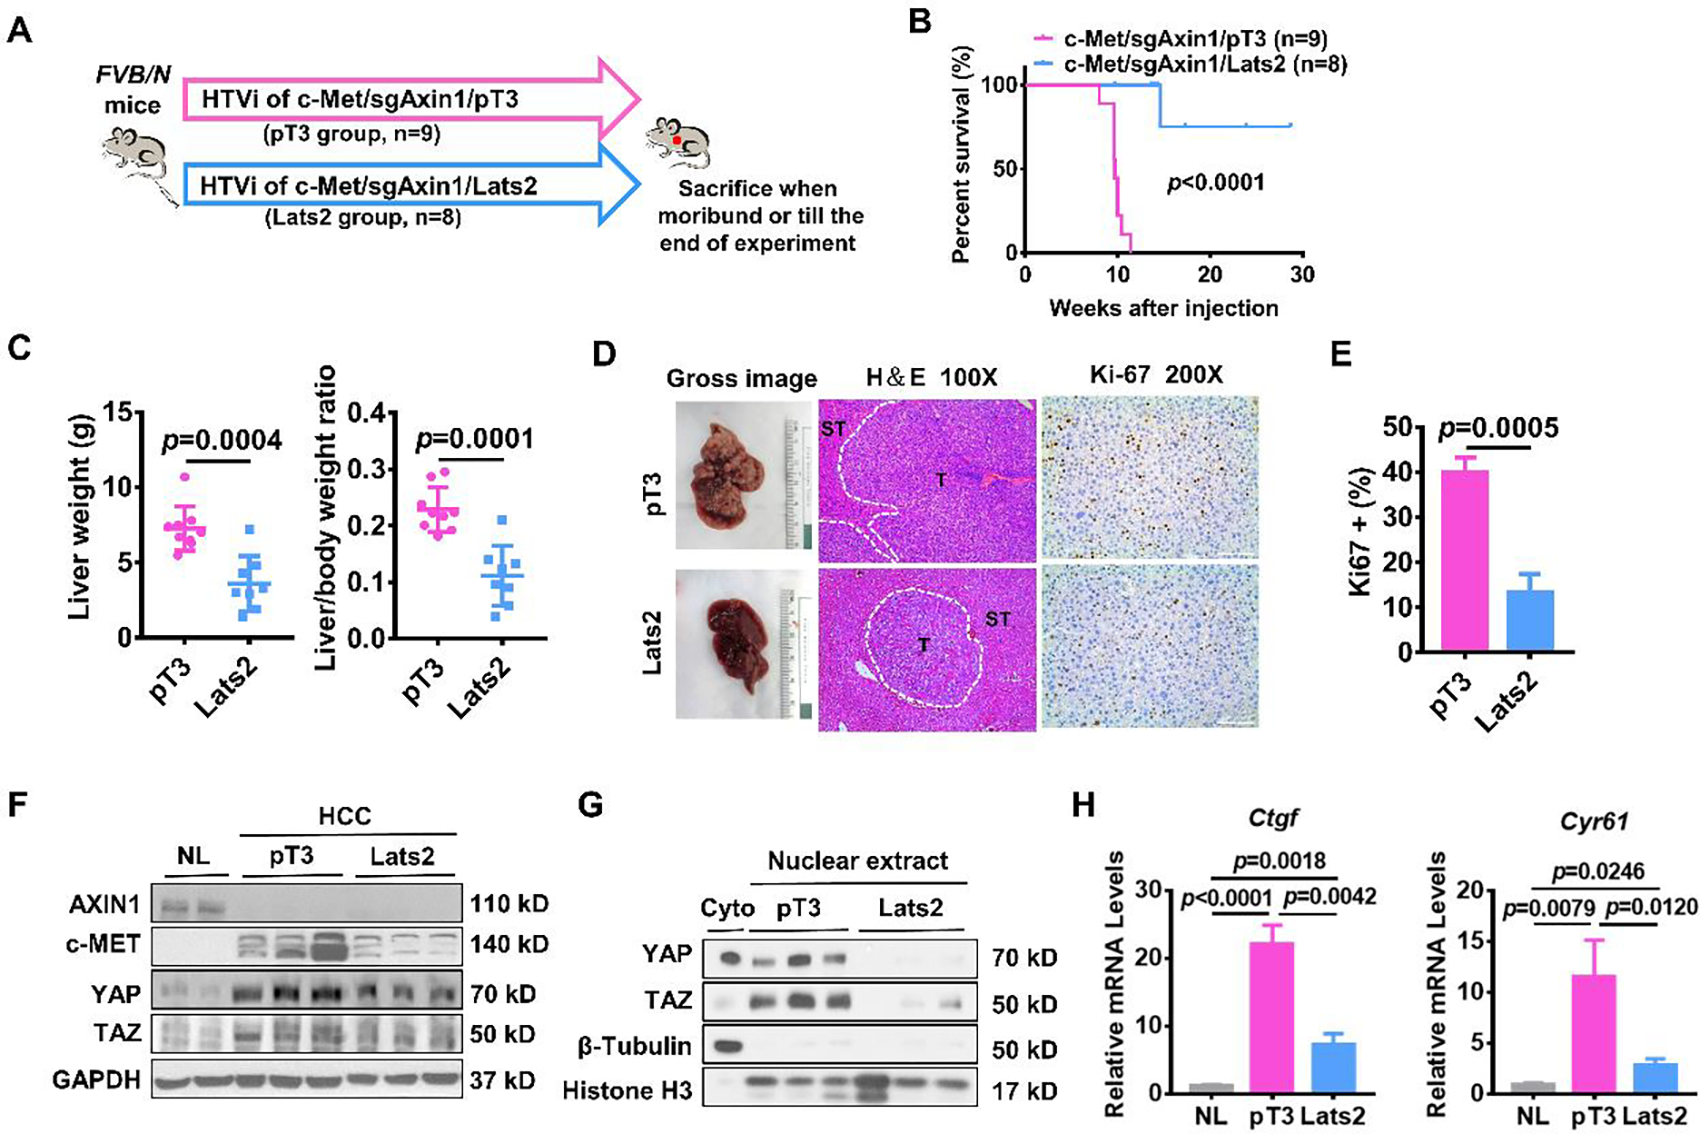
Figure 2. Lats2 overexpression blocks c-Met/sgAxin1 mouse HCC development.

(A) Study design. FVB/N mice were injected with c-Met/sgAxin1/pT3 (n=9) and c-Met/sgAxin1/Lats2 (n=8) plasmids using hydrodynamic tail vein injection (HTVi). (B) Survival curve of mice in both groups. Kaplan-Meier comparison was performed, p<0.0001. (C) Comparisons of liver weight and liver weight to body weight ratio in both groups. (D) Representative images of macroscopic pictures, H&E, and Ki-67 staining of the tumors in both groups. Scale bars: 200μm for 100X, 100μm for 200X. (E) Quantification of Ki67 positive percentage in both groups. (F) Levels of AXIN1, c-MET, YAP, and TAZ determined by Western blot analysis. GAPDH was used as a loading control. (G) Expression of nuclear YAP and TAZ determined by Western blot analysis. β-Tubulin and Histone H3 levels were used as a loading control. (H) Comparisons of Ctgf and Cyr61 mRNA expression in mouse normal liver (NL), c-Met/sgAxin1/pT3, and c-Met/sgAxin1/Lats2 mouse HCC tissues.
