
Figure 1 |.
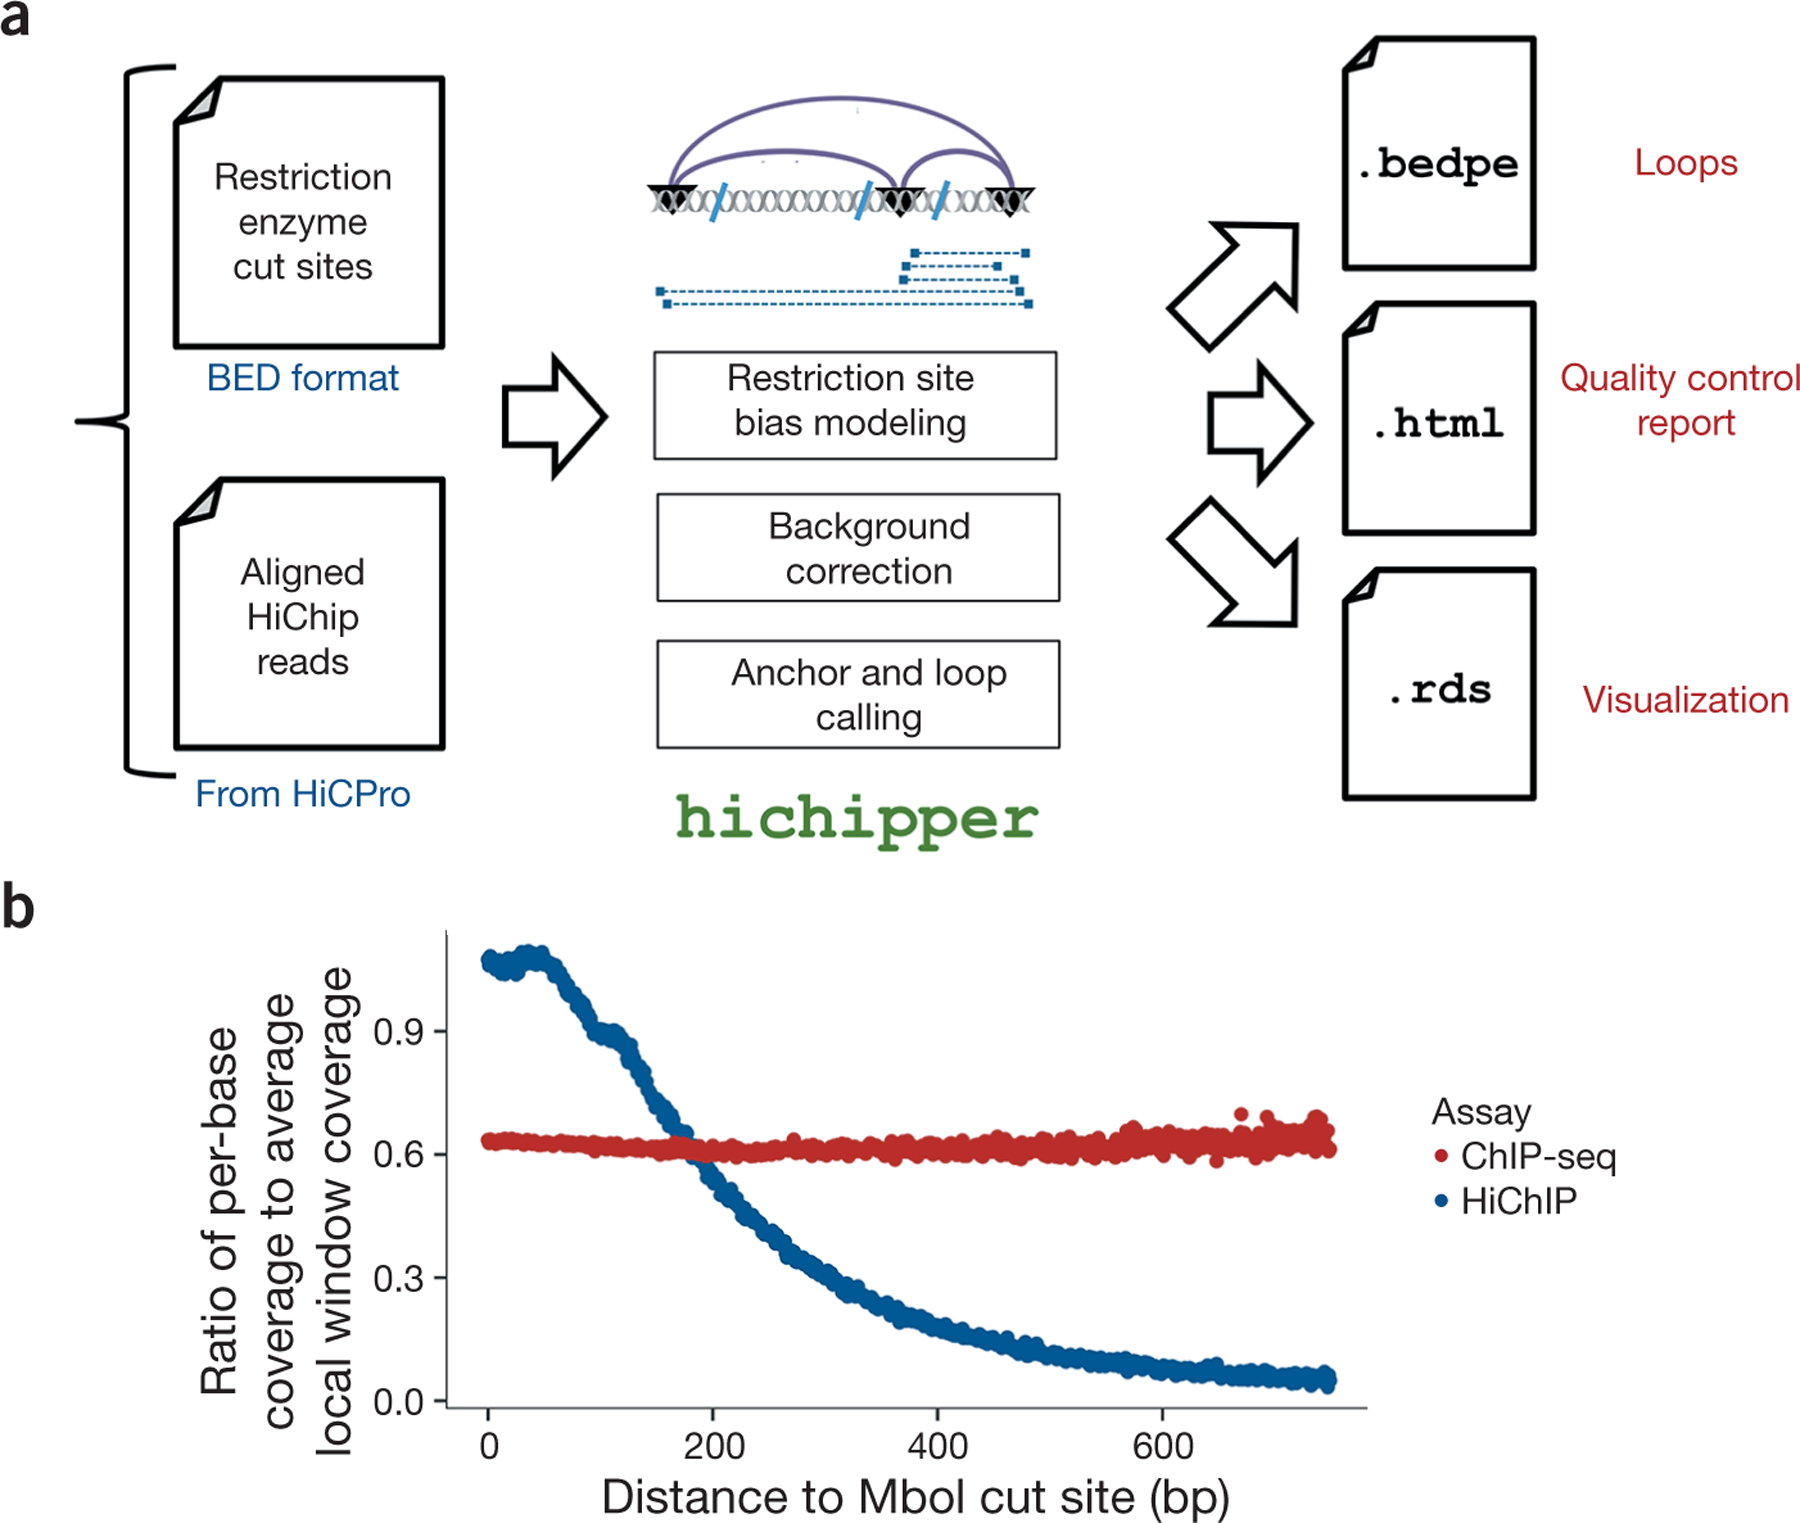
Overview of the hichipper analysis pipeline. (a) hichipper requires aligned and annotated interaction files from preprocessing tools such as Hi-C Pro2 as well as a .bed file of restriction sites. The output of hichipper can be used for quality control, visualization, and downstream topology analysis of HiChIP data. (b) Ratio of per-base coverage to local MACS-estimated local window background signal as a function of distance to nearest MboI cut site for a HiChIP sample (blue) and a ChIP-seq sample (red). Both samples represent published mouse embryonic stem cells (ESCs) with SMC1 (cohesin) ChIP1.