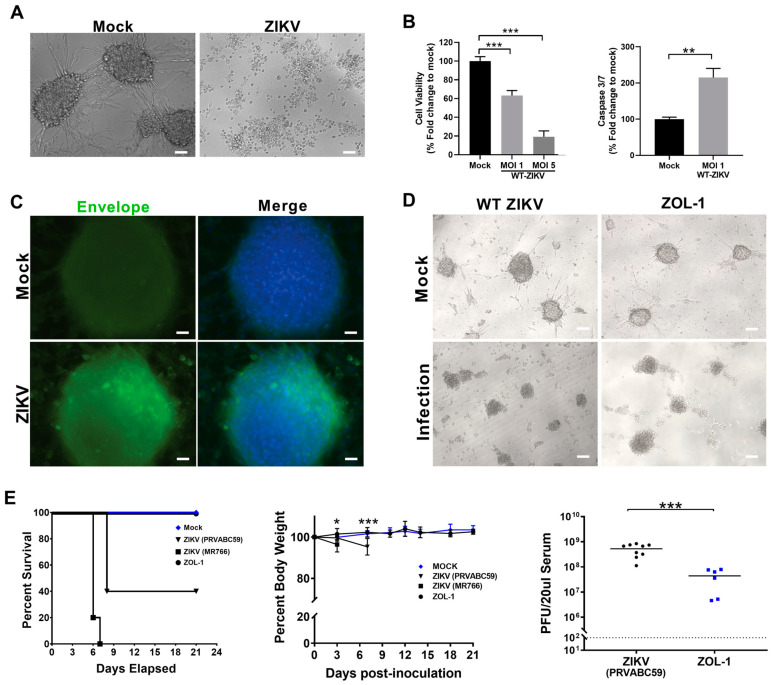
Figure 1.
ZOL-1 replication in neurospheres and mice. (A) Bright-field images of ZIKV-infected (MOI 5) and uninfected (mock) U87 GBM cancer cells. (Scale bar: 50 μm.) (B) Cell viability and apoptosis. (C) Fluorescent microscopy images of mock- and ZIKV-infected (MOI 1) U87 glioma neurosphere cultures 2 dpi. A pan-flaviviral Envelope antibody was used to detect ZIKV-infected cells. (Scale bar: 25 μm.) Green = ZIKV Envelope protein; blue = DAPI. (D) Bright-field images of mock-, WT ZIKV (MOI 1)-, and ZOL-1 (MOI 1)-infected GBM spheroids 6 dpi. (Scale bar: 100 µm.) (E) Kaplan–Meier survival plot shows percent survival of Ifnar1−/− mice after inoculation with wild-type ZIKV (Asian and African strains) or ZOL-1 (n = 6 per group). Mean percent body weight change of mice after subcutaneous inoculation with mock, wild-type ZIKV, or ZOL-1 viruses. Serum viral load of ZOL-1 in inoculated mice 7 dpi. Dotted line indicates detection limit. Error bars represent the standard deviation. Student’s t-test: p-value < 0.05 (*), p < 0.001 (**), p < 0.0001 (***).

