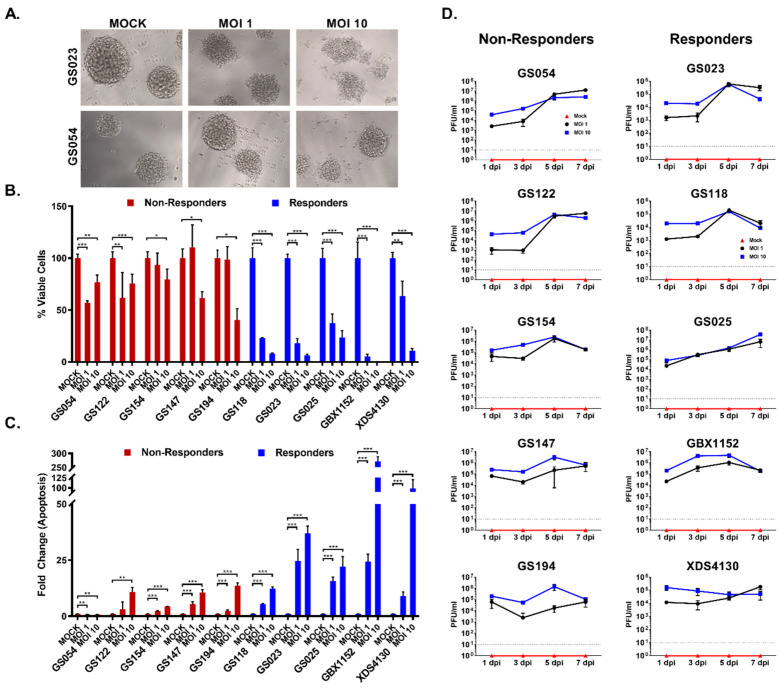
Figure 2.
ZOL-1-mediated cell killing of patient-derived GBM tumor lines. (A) Bright-field images of ZOL-1-infected GBM responder (GS023) and non-responder (GS054) lines 7 dpi. (B) Cell viability of responder and non-responder tumor lines upon inoculation with ZOL-1 (MOI 1 or 10) or mock inoculation. (C) Apoptotic cell death, as measured using caspase 3/7 activity, of responder and non-responder tumor lines upon inoculation with ZOL-1 (MOI 1 or 10) or mock inoculation. (D) Viral titer of ZOL-1 in various GBM non-responders (left) and responders (right). Dotted line indicates detection limit. Error bars represent the standard deviation. Student’s t-test: p-value < 0.05 (*), p < 0.001 (**), p < 0.0001 (***).

