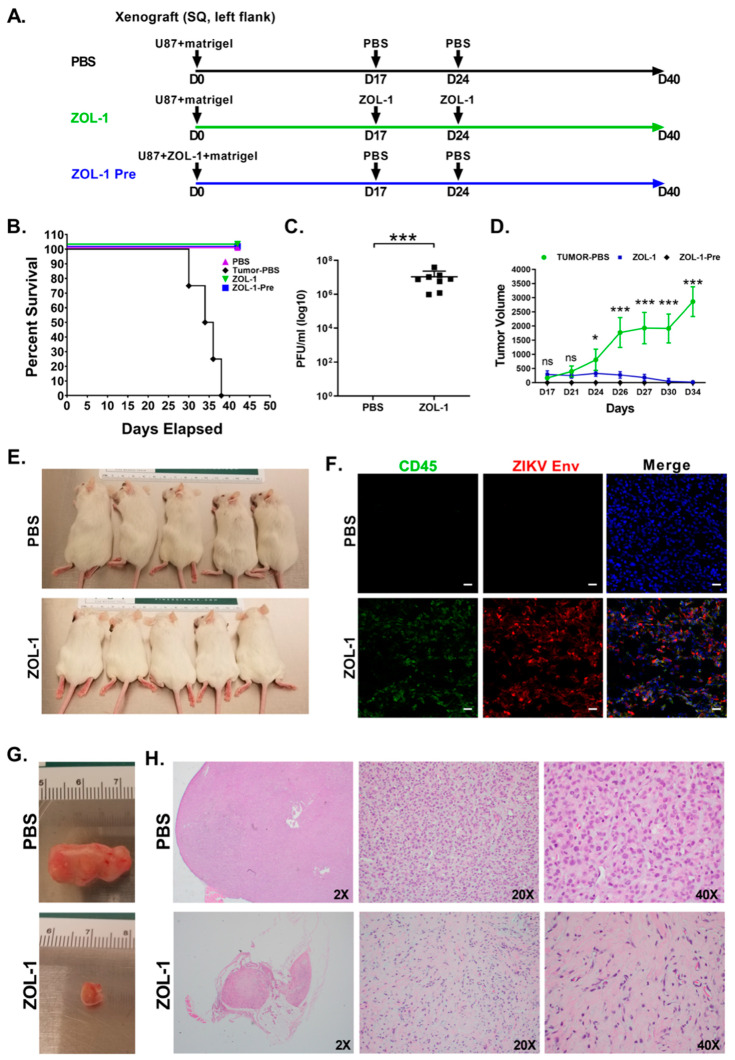
Figure 3.
ZOL-1 efficacy against tumor xenograft in NSG mice. (A) Experimental design of GBM xenograft study with ZOL-1 treatment (n = 8 per group). (B) Kaplan–Meier survival plot shows percent survival of NSG mice upon mock treatment, or pre-treatment or treatment with ZOL-1. (C) Viral load of ZOL-1-treated mice at study endpoint (42 dpi). (D) Tumor volume measured post-xenograft injection over time. (E) Representative pictures of tumors in mock-treated and ZOL-1-treated mice show reduction in tumor size upon treatment with ZOL-1. (F) Immunofluorescence images show CD45 and ZIKV Envelope protein 7 dpi. (G) Representative images of resected tumors from mock-treated (top) and ZOL-1-treated (bottom) mice. (H) Histopathological analysis of ZOL-1-treated tumors compared with mock-treated tumors (image magnifications are provided). Error bars represent the standard deviation. Student’s t-test: p-value not significant (ns), p < 0.05 (*), p < 0.0001 (***).

