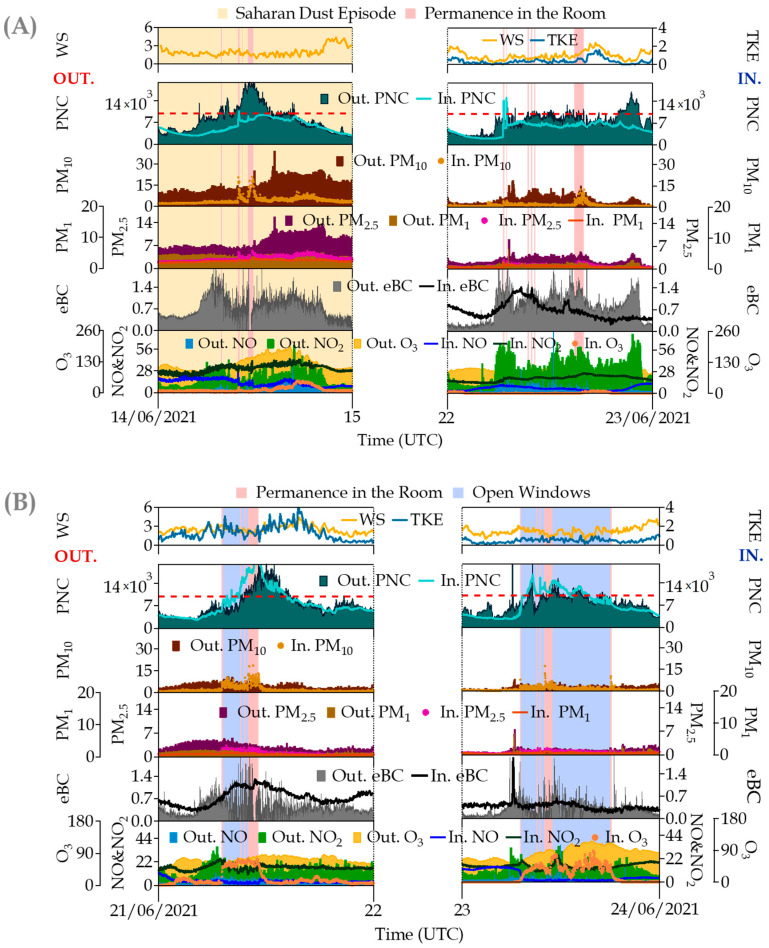
Figure 7.
Simultaneous time series of indoor/outdoor (I/O) pollutants measured at the university site in some occupancy periods during the summer campaign: (A) Permanence in the room + Saharan dust episode (14 June 2021) and Permanence in the room (22 June 2021) and (B) Permanence in the room + open windows. Parameters (units) are denoted in the graphs as follows: WD = wind direction (m s−1); TKE = Turbulent Kinetic Energy (m2 s−2); PNC = Ultrafine Particle Number Concentration (cm−3); PM10, PM2.5 and PM1 = particulate matter mass fractions (μg·m−3); eBC = equivalent Black Carbon (μg·m−3); and NO, NO2 and O3 = Trace gas pollutants (all in μg·m−3). The red dotted line in PNC represents the optimal detection range of the indoor CPC (0–1 × 104 cm−3). In the graph, the prefix “Out.“ refers to outdoor measurements whereas “In.“ indicates indoor measurements.

