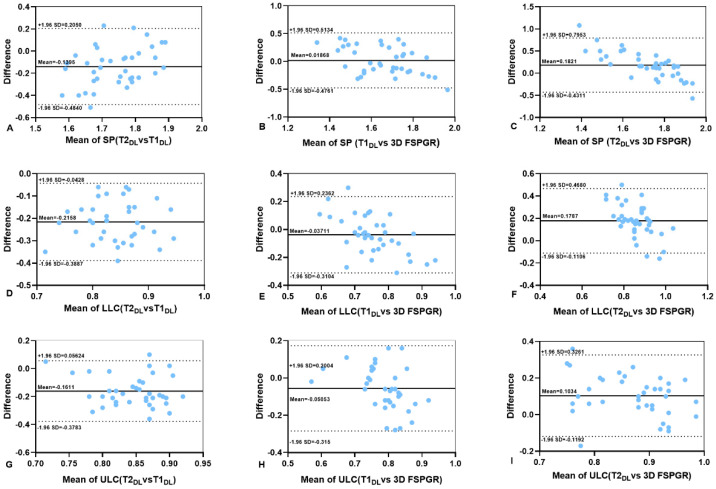
Figure 5.
(A–I) Bland–Altman analyses of the differences between the thicknesses of cartilage measured on T1WIDL, T2WIDL, and 3D FSPGR. The upper and lower dashed black lines are limits of agreement and the full black lines are mean differences between images. T1WIO = original T1-weighted FSE images, T1WIDL = deep learning–reconstructed T1-weighted FSE images, T2WIO = original T1-weighted FSE images, T2WIDL = deep learning–reconstructed T2-weighted FSE images, 3D FSPGR = three-dimensional fast spoiled gradient-recalled images. SP = septal cartilage, ULP = upper lateral cartilage and LLC = lower lateral cartilage.

