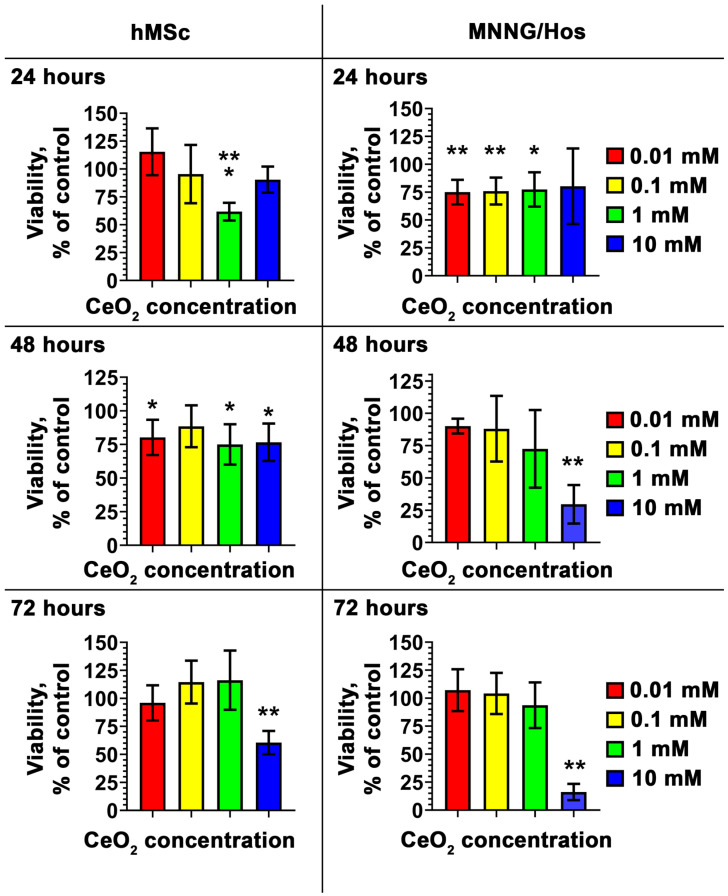
Figure 2.
Viability of hMSc and MNNG/Hos cells 24, 48, and 72 h after incubation with calcein-modified CeO2 NPs at various concentrations (0.01–10 mM) via MTT assay. Data are presented as standard deviation (SD). The statistical significance of deviations between the control and test samples is indicated by *, where * p < 0.05, ** p < 0.01 and *** p < 0.001.

