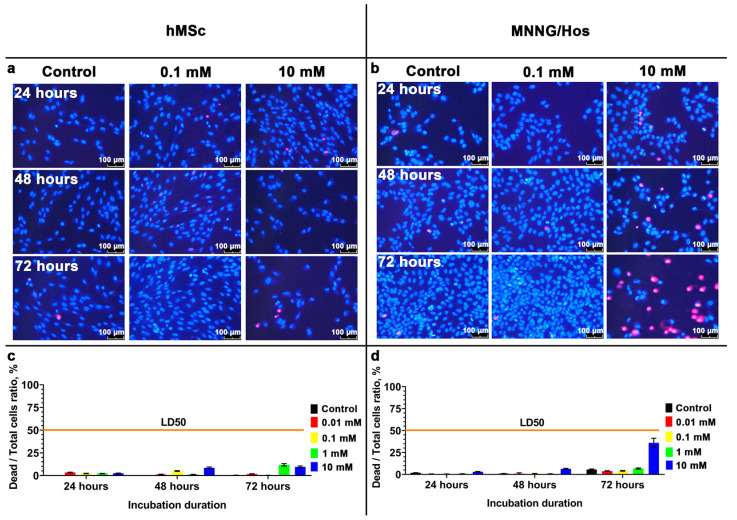
Figure 3.
Live/Dead assay of hMSc and MNNG/Hos cells 24, 48, and 72 h after incubation with calcein-modified CeO2 NPs at various concentrations (0.01–10 mM). Cells were stained with fluorescent dyes Hoechst 33,342 (stains the nuclei of all cells blue) and propidium iodide (stains the nuclei of dead cells red) (a,b), and quantitative analysis of dead cells (c,d). The IC50 line corresponds to a value of 50% dead cells. The data on the c and d panels are presented as mean ± SD.

