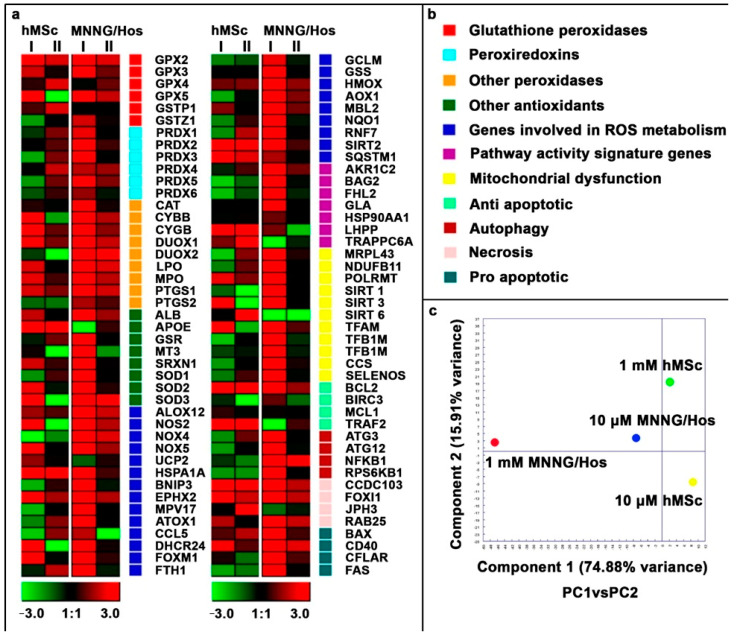
Figure 7.
Gene expression in hMSc and MNNG/Hos cell lines after 24 h of incubation with the calcein-modified CeO2 NPs at various concentrations (1 mM (I) and 10 μM (II)). Data are presented as a heat map (a). The intensity scale for standardized gene expression values ranges from −3 (green, decreased expression) to 3 (red, increased expression) with an intermediate intensity of 1:1 (black) corresponding to control values. Cluster groups of genes with the designation of their functions and colors on the heat map (b). Principal component analysis (PCA) of qRT-PCR data for various cell lines and calcein-modified CeO2 NP concentrations (c).

