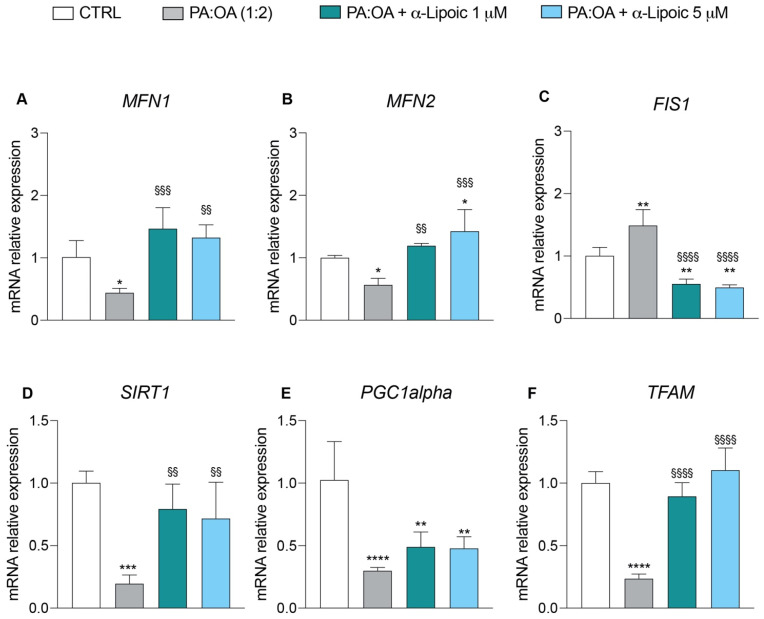
Figure 6.
Real-time PCR analysis of genes involved in mitochondrial dynamics and biogenesis. mRNA expression levels of (A) MFN1, (B) MFN2, (C) FIS1, (D) SIRT1, (E) PGC1α, and (F) TFAM after 6 h of treatment. Values represent the mean ± SD of experiments performed in quadruplicate. * vs. CTRL (* p < 0.05, ** p < 0.01, *** p < 0.001, **** p < 0.0001); § vs. PA:OA (§§ p < 0.01, §§§ p < 0.001, §§§§ p < 0.0001).

