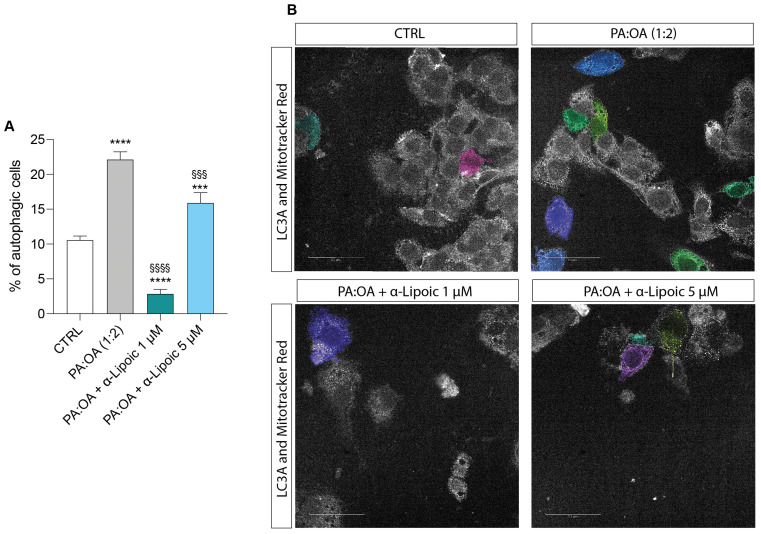
Figure 8.
Computerized analysis of LC3A and % of autophagic cells. * vs. CTRL (*** p < 0.001, **** p < 0.0001); § vs. PA:OA (§§§ p < 0.001, §§§§ p < 0.0001). (A) quantification of % of autophagic cells; (B) Representative images of autogaphy-positive cells. The figures presented are representative of at least three independent experiments. Scale bars in (B) 50 μm.

