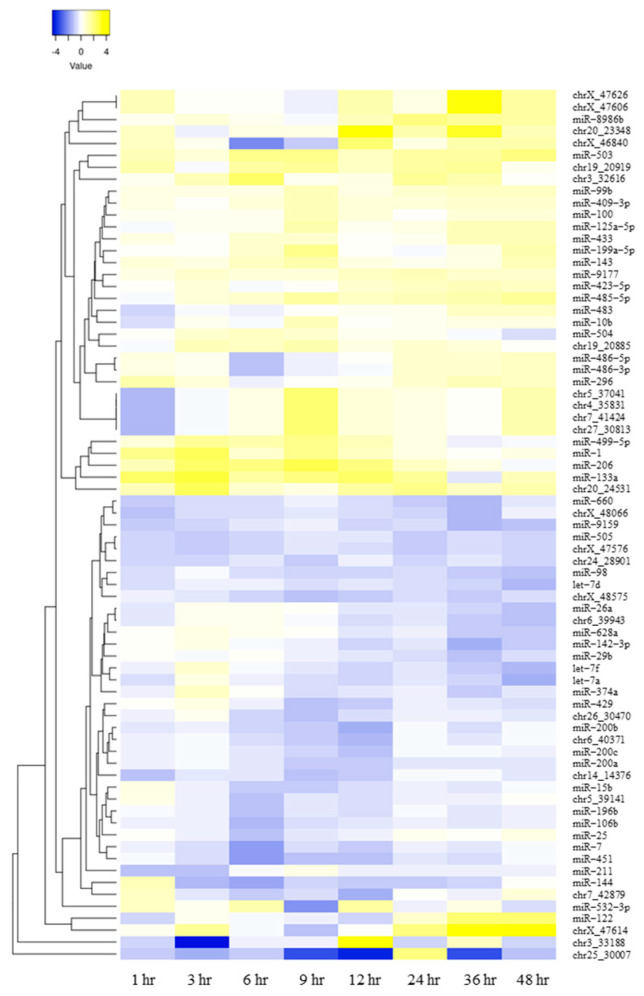
Figure 3.
Hierarchical clustering heat map of the expression of differentially expressed circulating miRNAs after hydrocortisone administration. The log2 fold-change value of 73 miRNAs with a significant variation of |log2 fold-change| ≥ 1 by small RNA-seq was indicated in the dendrogram of the hierarchical clustering heat map. Fold changes were calculated as log2 (after administration/time-matched control). The miRNAs in yellow and violet indicate high and low expression, respectively. The log2 fold-change of chr3_33188 was out of range at −11.37 at 3 h and 8.66 at 12 h after administration.

