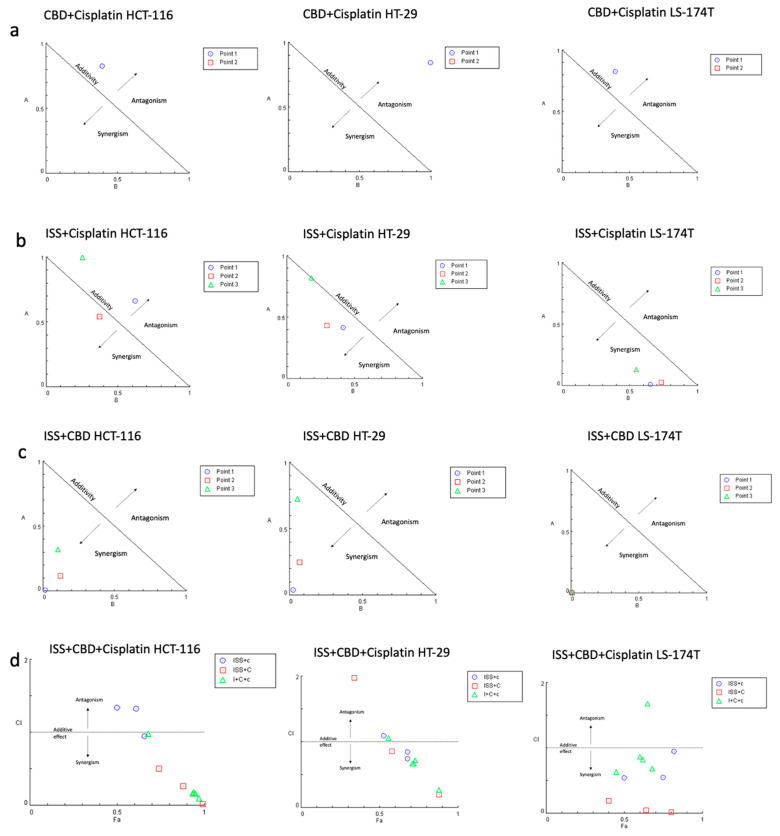
Figure 2.
The combination effects of (a) CBD and cisplatin; (b) cisplatin and ISS; (c) CBD and ISS; and (d) CBD, ISS, and cisplatin in CRC cell lines based on cell viability. (a) Normalized isobologram for the combination of CBD and cisplatin with normalization of the dose with IC50 to the unity of both x- and y-axis in HCT-116, HT-29, and LS-174T. All the combination points indicated the antagonistic interaction. Abbreviations: A—cisplatin (D)1/(IC50)1; B—CBD (D)2/(IC50)2; D—dose; Point 1—the combination of CBD IC70 and ISS IC50; Point 2—the combination of CBD IC75 and cisplatin IC75. (b) Normalized isobologram for the combination of ISS and cisplatin with normalization of the dose with IC50 to the unity of both x- and y-axis in the HCT-116, HT-29, and LS-174T. Most of the combination points indicated synergistic interaction, except for the HCT-116 CRC cell line. Abbreviations: A—ISS (D)1/(IC50)1; B—cisplatin (D)2/(IC50)2; D—dose; Point 1—the combination of cisplatin IC70 and ISS IC50; Point 2—the combination of cisplatin IC50 and ISS IC50; Point 3—the combination of cisplatin IC20 and ISS IC50. (c) Normalized isobologram for the combination of ISS and CBD with normalization of the dose with IC50 to the unity of both x- and y-axis in HCT-116, HT-29, and LS-174T. Most of the combination points indicated synergistic interaction. Abbreviations: A—ISS (D)1/(IC50)1; B—CBD (D)2/(IC50)2; D—dose; Point 1—the combination of CBD IC70 and ISS IC50; Point 2—the combination of CBD IC50 and ISS IC50; Point 3—the combination of CBD IC20 and ISS IC50. (d) Fa–CI plot for the combination of ISS, CBD, and cisplatin in HCT-116, HT-29, and LS-174T. Abbreviations: CI—combination index; Fa—fraction affected by the drug concentration (% of cell growth inhibition/100); ISS + c—the combination of ISS with cisplatin in different doses; ISS + C—the combination of ISS with CBD in different doses; I + C+c—the combination of ISS with CBD and cisplatin in different doses. The CI was calculated to quantify synergism and antagonism of the drugs, where CI < 1 indicates synergism, CI = 1—additive effect, and CI > 1—antagonistic effect. Normalized isobologram and Fa–CI plots were generated using CompuSyn software.

