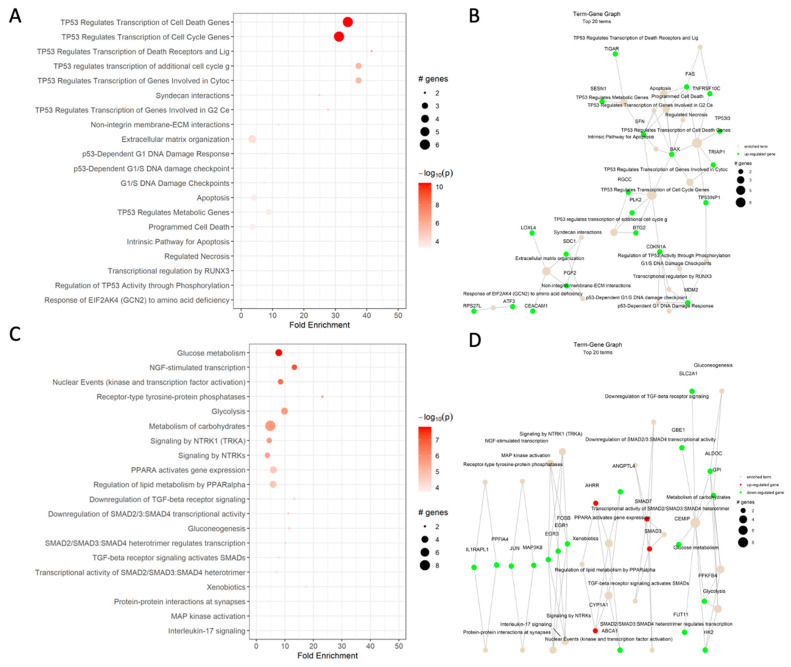
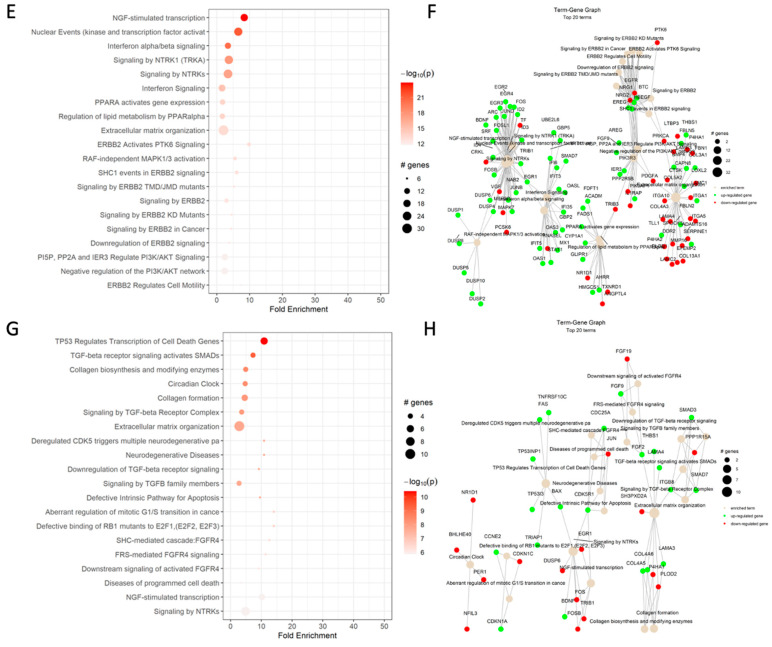
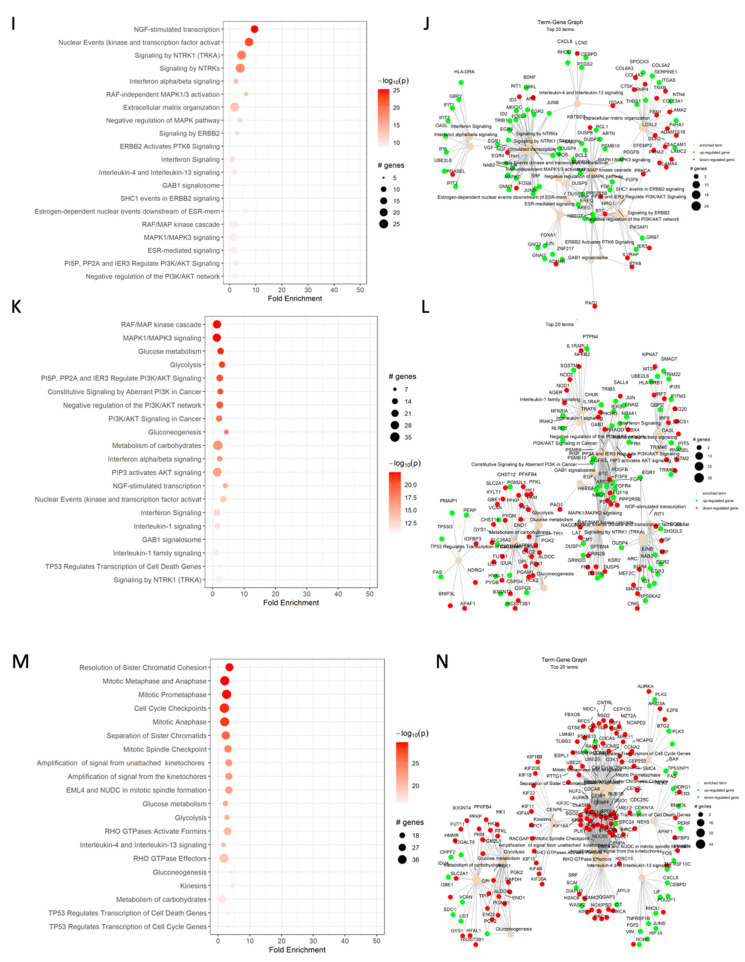
Figure 3.
Reactome dot plot (left) and Term-Gene Graph of top 20 terms for (A,B) cisplatin vs. DMSO, (C,D) CBD vs. DMSO, (E,F) ISS vs. untreated, (G,H) cisplatin and CBD vs. DMSO, (I,J) cisplatin and ISS vs. DMSO, (K,L) CBD and ISS vs. DMSO, and (M,N) cisplatin, CBD, and ISS vs. DMSO in the HCT-116 CRC cell line. The top 20 terms with the highest fold change are shown in plots to the left, with their corresponding Reactome pathways on the y-axis. The size of the dots represents the number of genes in each pathway, while the red color’s intensity indicates the enrichment’s significance. The most enriched pathways are shown at the top of the plot. The graphs to the right side display the top 20 Reactome terms and their corresponding gene sets. Each node represents a Reactome term, and the size of the node is proportional to the number of genes associated with that term. The edges between the nodes represent the overlap in gene sets between the terms. The edge’s thickness represents the overlap’s magnitude, and the edge’s color represents the direction of the overlap, with green for upregulated and red for downregulated genes. Figures were generated using pathfindR enrichment analysis software.


