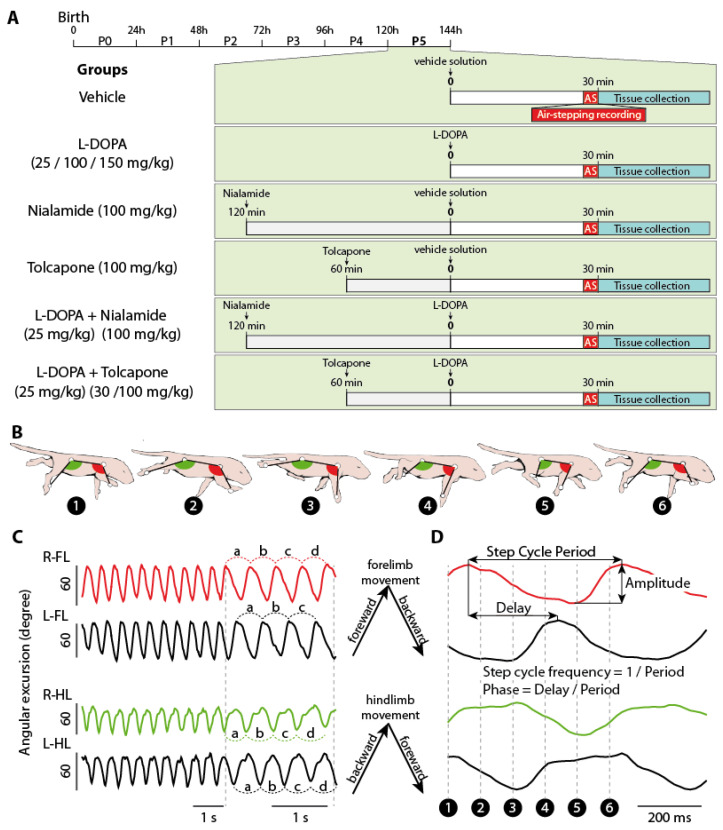
Figure 1.
Experimental paradigm. (A) Timeline of the experiments and experimental groups. (B) Schematic diagrams of a newborn rat expressing air-stepping. Each diagram represents the animal at a different timepoint of a step cycle. The angular excursion of the limbs are measured from the kinematic markers (white dots). (C) Angular excursions of all 4 limbs during a sequence of air-stepping. On the enlarged portion (middle) are shown 4 successive step cycles (a, b, c, d) together with the direction of the forelimb and hindlimb movements. (D) Angular excursions of one single step cycle from which were calculated the different locomotor parameters. Dotted lines indicate the timepoints corresponding to the schematic diagrams in (B).

