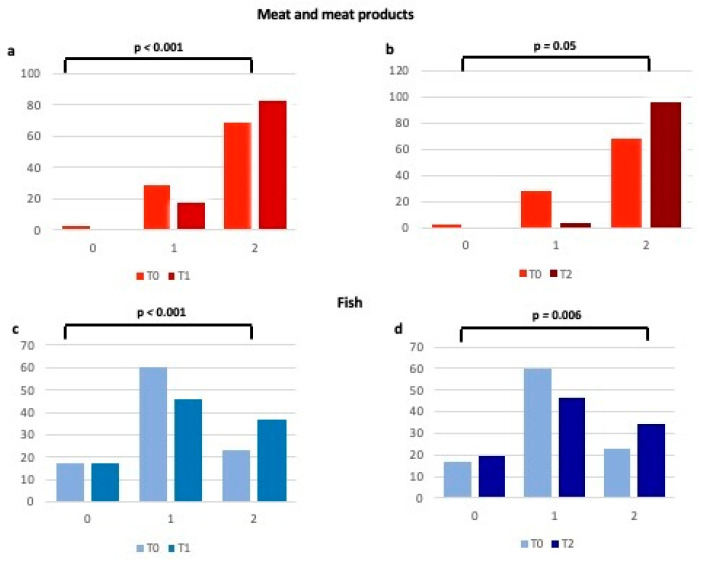
Figure 4.
Changes in adherence to the Mediterranean Diet (expressed as percentages) for meat and meat products and fish consumption from T0 to T1 (a,c) and from T0 to T2 (b,d). 0 = 0 points at the Mediterranean adherence score; 1 = 1 point at the Mediterranean adherence score; 2 = 2 points at the Mediterranean adherence score.

