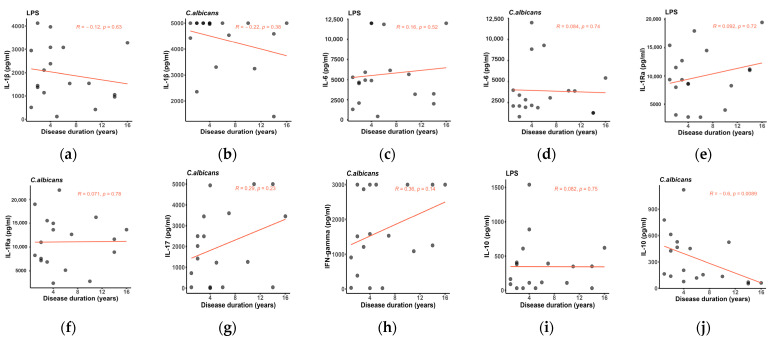
Figure 2.
(a–j) Scatter plots showing the correlation analysis between induced cytokine production in PBMCs from SSc patients and disease duration, Spearman’s correlation coefficient. The fitted linear regression line of each scatter plot (red) is depicted along with the R and p-values. IL-17 and IFN-gamma registered a positive trend with disease progression, while IL-10 concentrations significantly decreased with increasing disease duration. This correlation was evident only upon stimulation with heat-killed Candida albicans.

