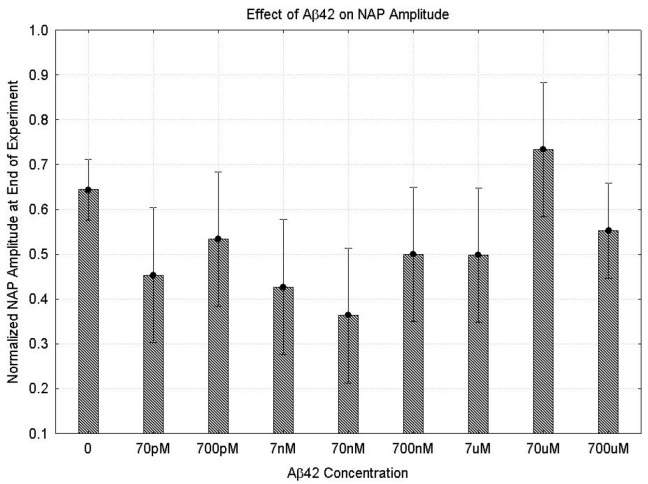
Figure 1.
Changes in the peak-to-peak NAP amplitude at the end of the experiment as a function of Aβ42 concentration. All data are taken from the first stimulus in the second set of stimuli (166 ms ISI and 15 mA stimulus current). The amplitude is normalized so that the amplitude of the NAP at the beginning of the experiment is one. The bars indicate the interquartile range. The differences between different conditions are significantly different (ANOVA (F (8103) = 3.08, p = 0.004)).

