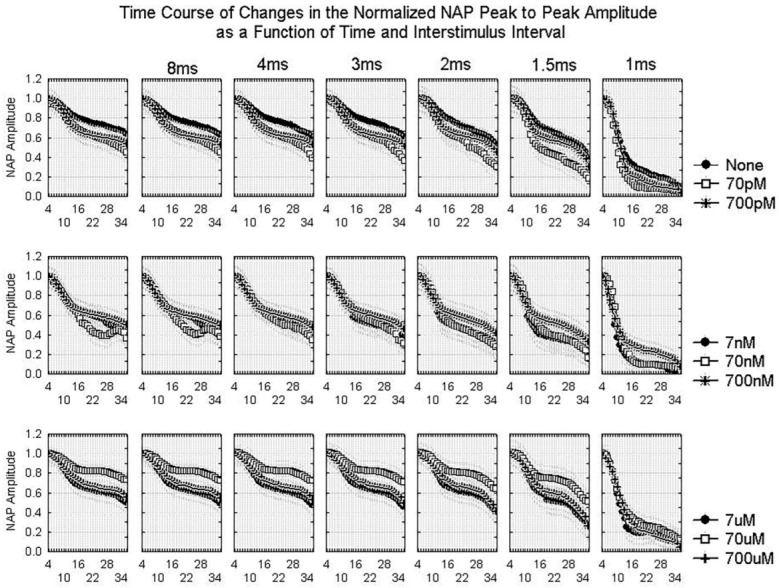
Figure 2.

Averaged time course of changes in the normalized NAP peak-to-peak amplitude during the course of an experiment for different interstimulus intervals and different Aβ42 concentrations with a 15 mA stimulus current. Because of the normalization procedure, all NAP peak-to-peak amplitudes are set at one for the beginning of the experiment. The different curves represent either the control condition (“none”) or responses in the presence of various concentrations of Aβ42. The x-axis represents the number of 30 min periods from the beginning of the experiment. Repeated measures ANOVA shows significant effects of EXPTTIME, CONC, and ISI as well as significant CONC*ISI, ISI*EXPTTIME, and CONC*EXPTTIME interactions, all with p < 0.001 (Table S4).
