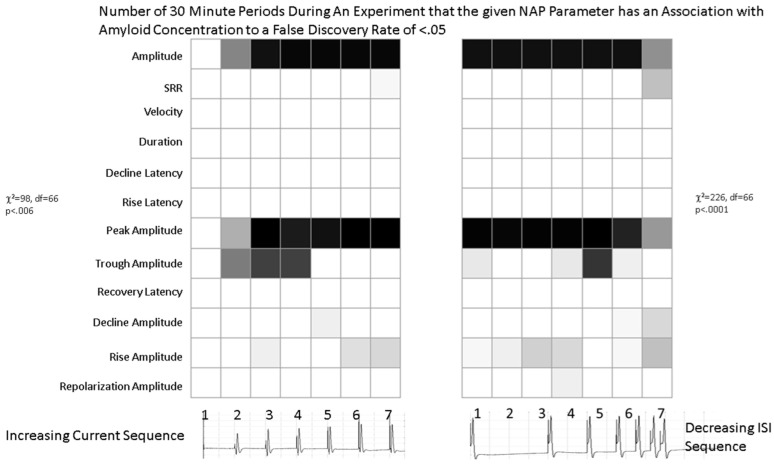
Figure 4.
Graphical tables indicating the number of 30 min time periods during which the Spearman rank correlation analysis shows a significant (FDR < 0.05) between the NAP characteristic on the left of the table and the Aβ42 concentration and for the specific stimulus shown on the bottom of the table. A white color in the table element indicates that the NAP characteristic was not affected by the concentration of Aβ42. Darker colors indicate conditions where there are more significant relationships between the NAP characteristic and the Aβ42 concentration. The χ2 test tests the question as to whether the pattern of significant effects is truly random. The different rows are different NAP parameters and the different columns represent different stimuli within a set.

