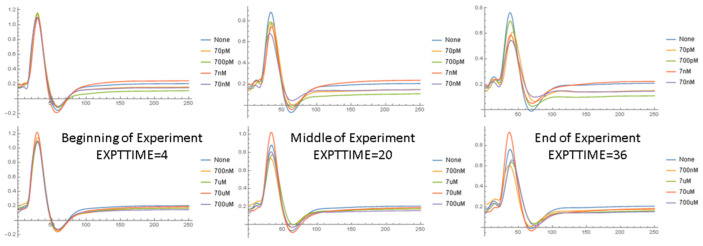
Figure 5.
Normalized NAP waveforms averaged over all nerves in same Aβ42 concentration category at the beginning of the experiment, middle of the experiment, and end of the experiment for the long (166 ms) inter-stimulus interval at different concentrations of Aβ42. Each curve represents a different concentration of Aβ42 and “none” is the control case in which no Aβ42 is added.

