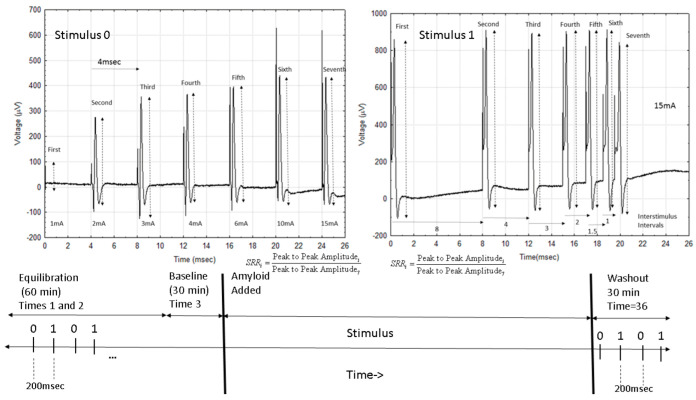
Figure 10.
Outline of the experiment. The top part of the figure shows the two different stimulus sets used with the first, keeping the interstimulus interval at 4 ms and increasing the stimulus current. The second maintains a constant stimulus current but gradually shortens the interstimulus interval. The lower graph shows an outline of each experiment and the fact that stimulus set 0 is delivered first followed by stimulus set 1 every 200 ms during the experiment. It also shows the initial equilibration period and the time that the amyloid is added into the fluid, bathing the nerve.

