Figure 7.
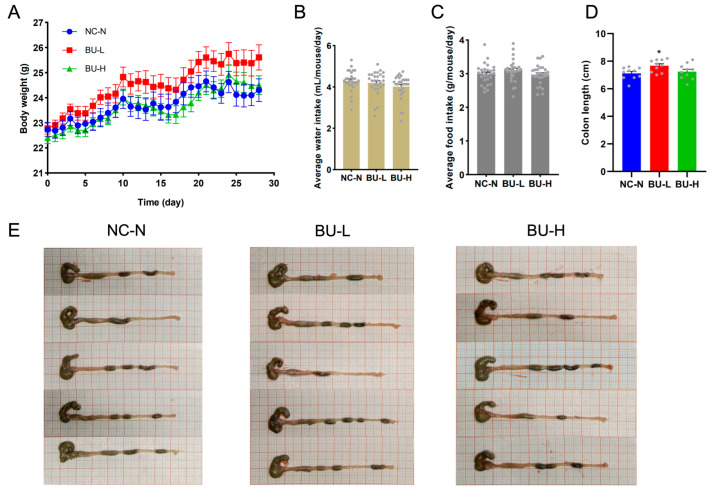
B. uniformis F18-22 was well tolerated in mice. Body weight change of the mice (A). Average water intake of the mice (B). Average food intake of the mice (C). Each gray dot in the panel (B,C) represents the value of the daily water intake and daily food intake. The water intake and food intake were monitored for 28 days. Colon length (D). Each gray dot in the panel (D) represents one mouse in the experiments. The NC-N group has 10 mice. The BU-L group has 10 mice. The BU-H group has 10 mice. Representative morphology of the colon (E). * p < 0.05 versus NC-N group.

