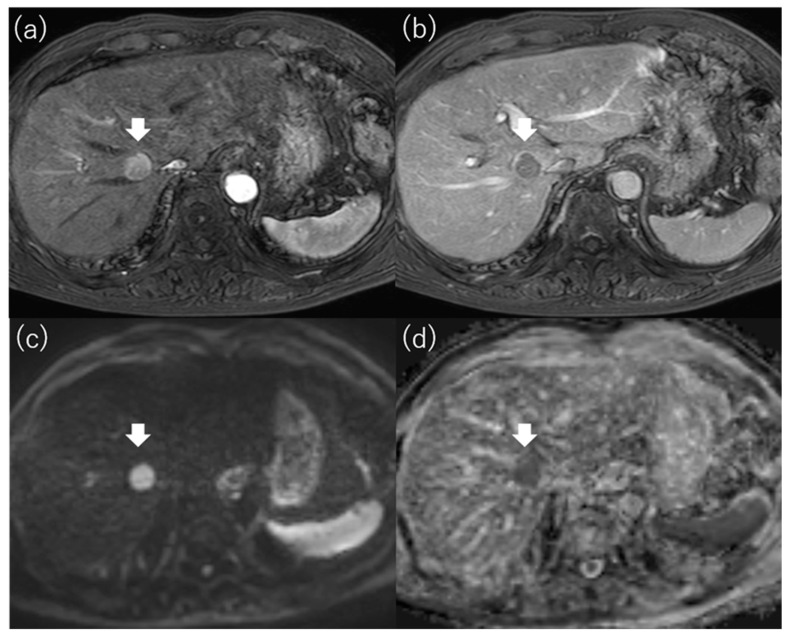
Figure 5.
Images of hypointense hepatocellular carcinoma on apparent diffusion coefficient map. Gd-EOB-DTPA-enhanced magnetic resonance imaging reveals a 1.7 cm hepatocellular carcinoma in segment 8 that shows staining in the arterial phase (a) and washout in the portal venous phase (b). The tumor is hyperintense on diffusion-weighted imaging with a b-factor of 1000 (c) and hypointense on the apparent diffusion coefficient map (d). Gd-EOB-DTPA, gadolinium ethoxybenzyl diethylenetriamine pentaacetic acid.

