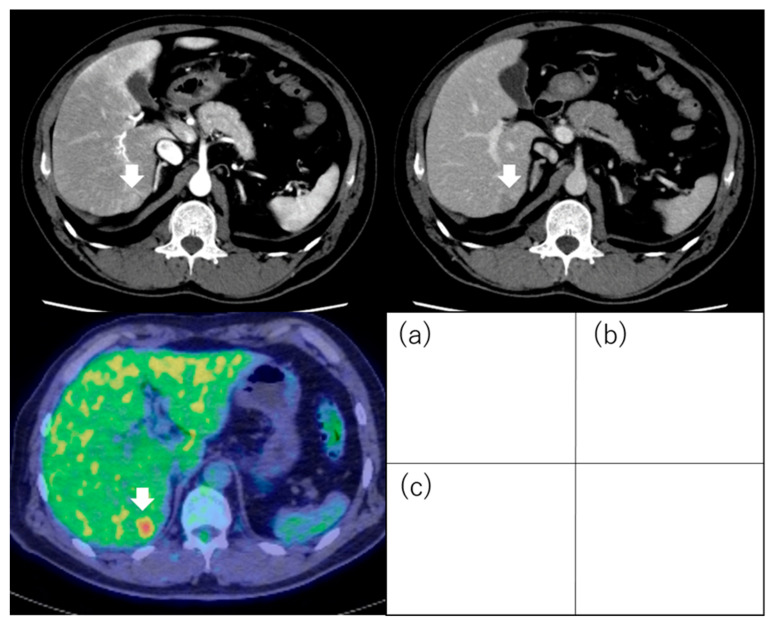
Figure 7.
Positron emission tomography images of hepatocellular carcinoma following 18F-fluorodeoxyglucose uptake. Hepatocellular carcinoma (1.8 cm, segment 6) with positive 18F-fluorodeoxyglucose uptake on positron emission tomography: The tumor exhibits staining during the arterial phase of contrast computed tomography (a) and washout during the equilibrium phase (b). The tumor has higher 18F-fluorodeoxyglucose uptake than that of the surrounding liver on positron emission tomography (c). Arrows indicate the tumor.

