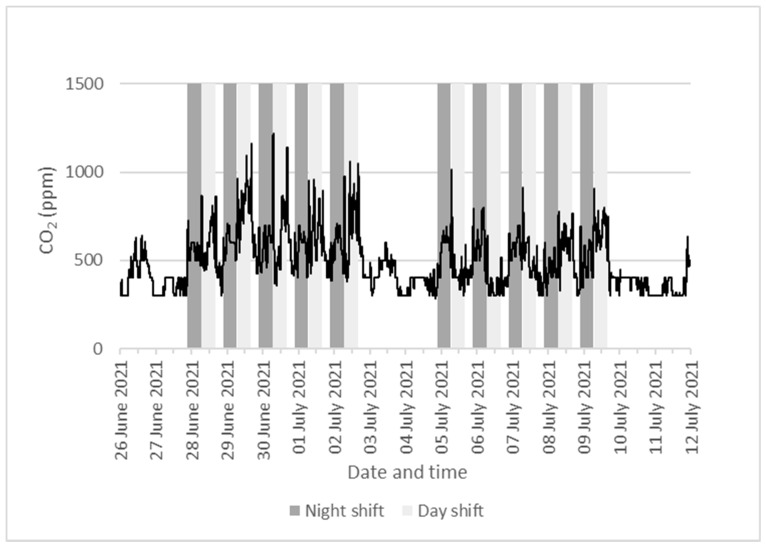
Figure 4.
Real-time CO2 measurements in the main locker room of the meat-processing plant between 25 June 2021 and 11 July 2021. The line graph shows 30-min rolling average of CO2 concentrations. The dark grey area covers night-shift time (Sunday–Friday, 21:30–06:30) and the light grey area covers day-shift time (Monday–Friday, 07:00–16:00).

