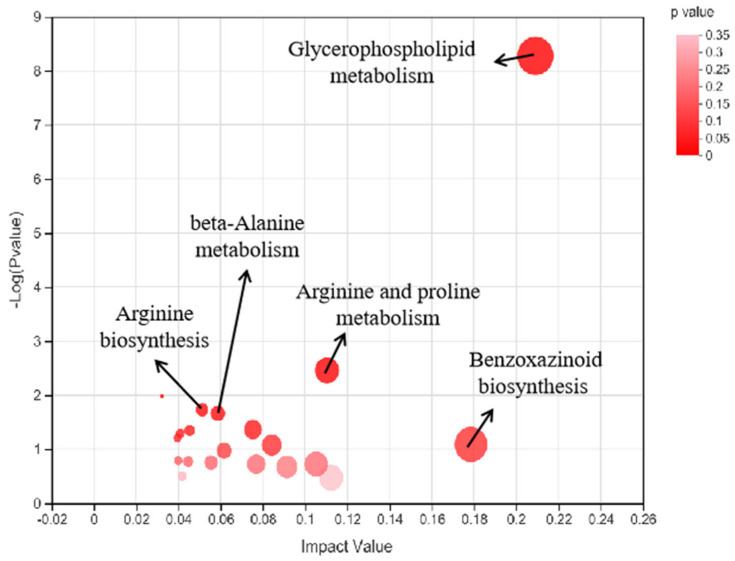
Figure 4.
The metabolome view map of the significant metabolic pathways characterized in the fermented milk samples. Circles represent metabolic pathways. The X-axis represents the pathway impact, and the Y-axis represents pathway enrichment. Larger sizes and darker colors indicate greater pathway enrichment and higher pathway impact values, respectively.

