Figure 4.
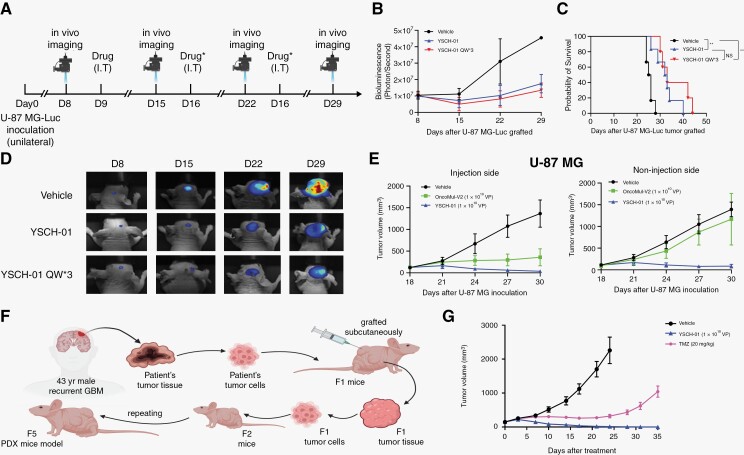
The oncolytic effect of YSCH-01 was further verified by intracranial glioma xenograft and patient-derived tumor xenograft. (A) Flow diagram of testing the efficacy of YSCH-01 in intracranial U-87 MG xenograft immunodeficient mice models. (B) Changes in tumor fluorescence intensity after drug administration (Vehicle, YSCH-01, triple injection of YSCH-01, n = 6 for each group). (C) Survival curves after drug administration (Vehicle, YSCH-01, triple injection of YSCH-01, n = 6 for each group) (Vehicle-YSCH-01: P = .0029; Vehicle-YSCH-01QW3: P = .0014; YSCH-01- YSCH-01QW3: P = .2693), n.s., not significant, **P < .01, Log-rank (Mantel-Cox) test. (D) The representative fluorescence imaging of the U-87 MG tumor. (E) The time plot of U-87 MG tumor volumes after drug treatment (Vehicle, OncoMul-V2, YSCH-01, n = 5 for each group) in subcutaneous xenograft immunodeficient mice models. (F) Flow diagram of establishing subcutaneous patient-derived tumor xenograft immunodeficient mice models. (G) The time plot of Balb/c-nude mice’s PDX tumor volumes after drug treatment (Vehicle, TMZ, YSCH-01, n = 10 for each group).

