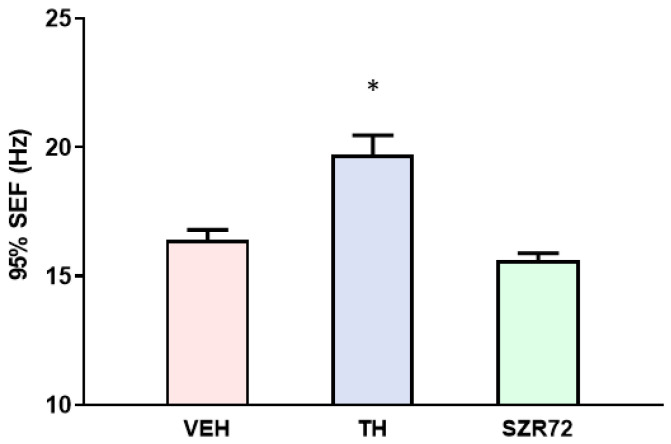
Figure 6.
Graph showing 95% spectral edge frequency (SEF) values in the experimental groups subjected to asphyxia. 95% SEF represents the EEG frequency below which 95% of EEG power resides. TH treatment resulted in significantly higher 95% SEF compared with the VEH group, while SZR72 treatment had no such effect. Data are shown mean ± SEM, * p < 0.05, significantly different from the VEH group.

