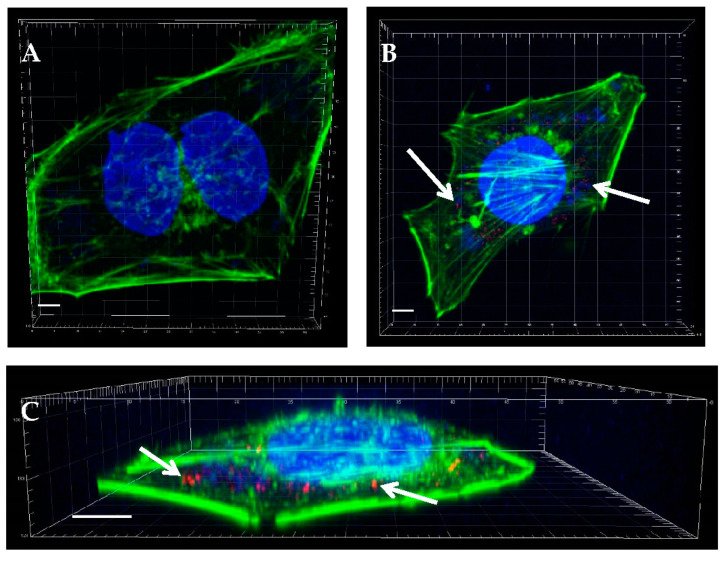
Figure 2.
Specific immunofluorescence staining of the EV71 infection of RD cells. (A) Uninfected control RD cells. (B) RD cells were infected with EV71 at a multiplicity of infection of 1, and imaged using confocal microscopy at 6 h post-infection. (C) Cross-sectional three-dimensional view of one representative infected cell depicting the staining of DNA (blue by DAPI) and actin (green using Alexa Fluor 488 phalloidin). EV71 particles appear red from immunolabeling with an EV71-specific primary antibody followed by a secondary antibody conjugated to Cy3. Arrows point to exemplify immunolabeled red virus particles, which are more prominent in the three-dimensional image in (C) compared with the two-dimensional image in (B). Scale bar represents 5 µm. Images were rendered using Imaris.

