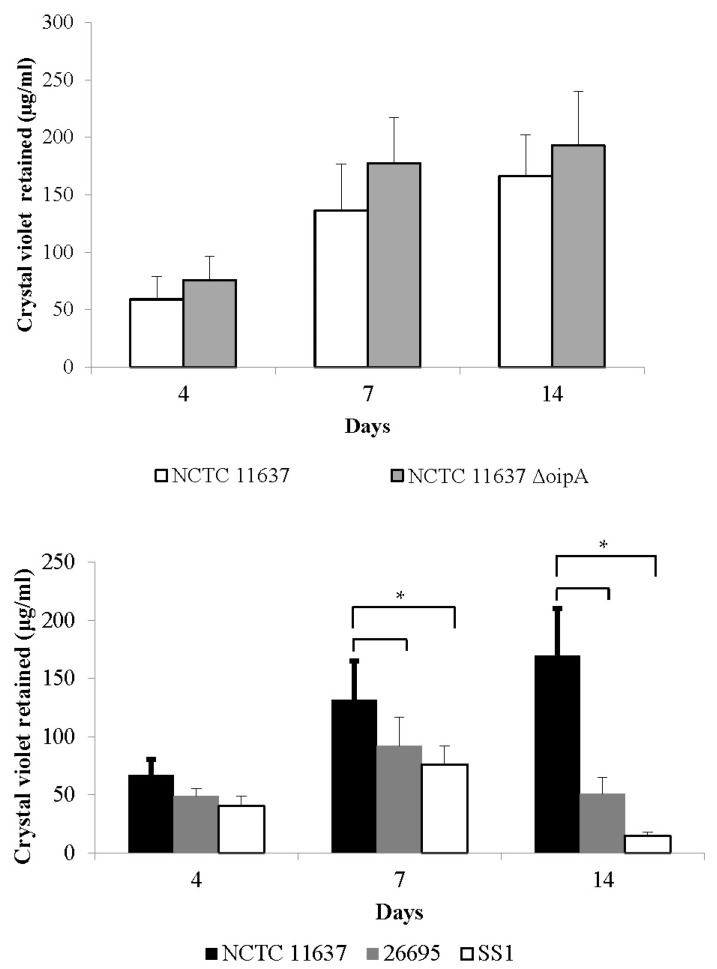
Figure 6.
Comparison of biofilm formation between different H. pylori strains over a period of 14 days. The formation of the biofilm at 4, 7, and 14 days was quantified using the crystal violet assay. Biofilm production was quantified as the concentration of crystal violet retained in the biofilm (expressed in µg/mL). The highest quantities of biofilm were generated by the NCTC11637ΔoipA isogenic mutant and NCTC11637 strains (upper panel). Strains 26695 and SS1 were moderate and poor biofilm producers, respectively, especially at 14 days, i.e., where we noted about 3-fold and 10-fold less biofilm than that observed for NCTC11637 (lower panel). The data represent mean values and standard errors derived from duplicates of three independent experiments. Statistical analyses were conducted using Student’s t-test. Asterisks (*) denote p-values < 0.05, which were considered statistically significant.

