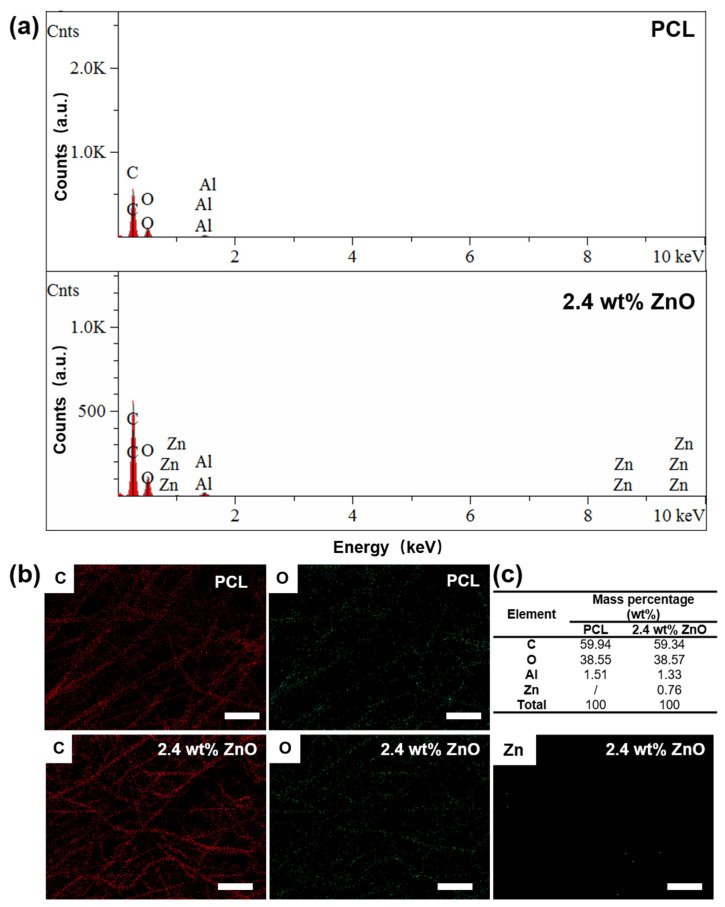
Figure 4.
EDX Characterisation of PCL/ZnO scaffold. (a) The EDX spectrum image of PCL and 2.4% wt% PCL/ZnO scaffolds. (b) C (red), O (green) and Zn element (orange) analysis of PCL and 2.4% wt% PCL/ZnO scaffolds using EDX. (c) The mass percentage of PCL and 2.4% wt% PCL/ZnO scaffolds measured using EDX. Scar bar is 10 μm.

